Exasol Dashboard


Overview of Exasol Dashboard
The Exasol Dashboard provides businesses, data scientists, and analysts an unrivaled platform for interacting with their Exasol data. Rendered in UI Bakery, this dashboard offers a seamless and smooth data interaction experience.
Highlights of the Exasol Dashboard:
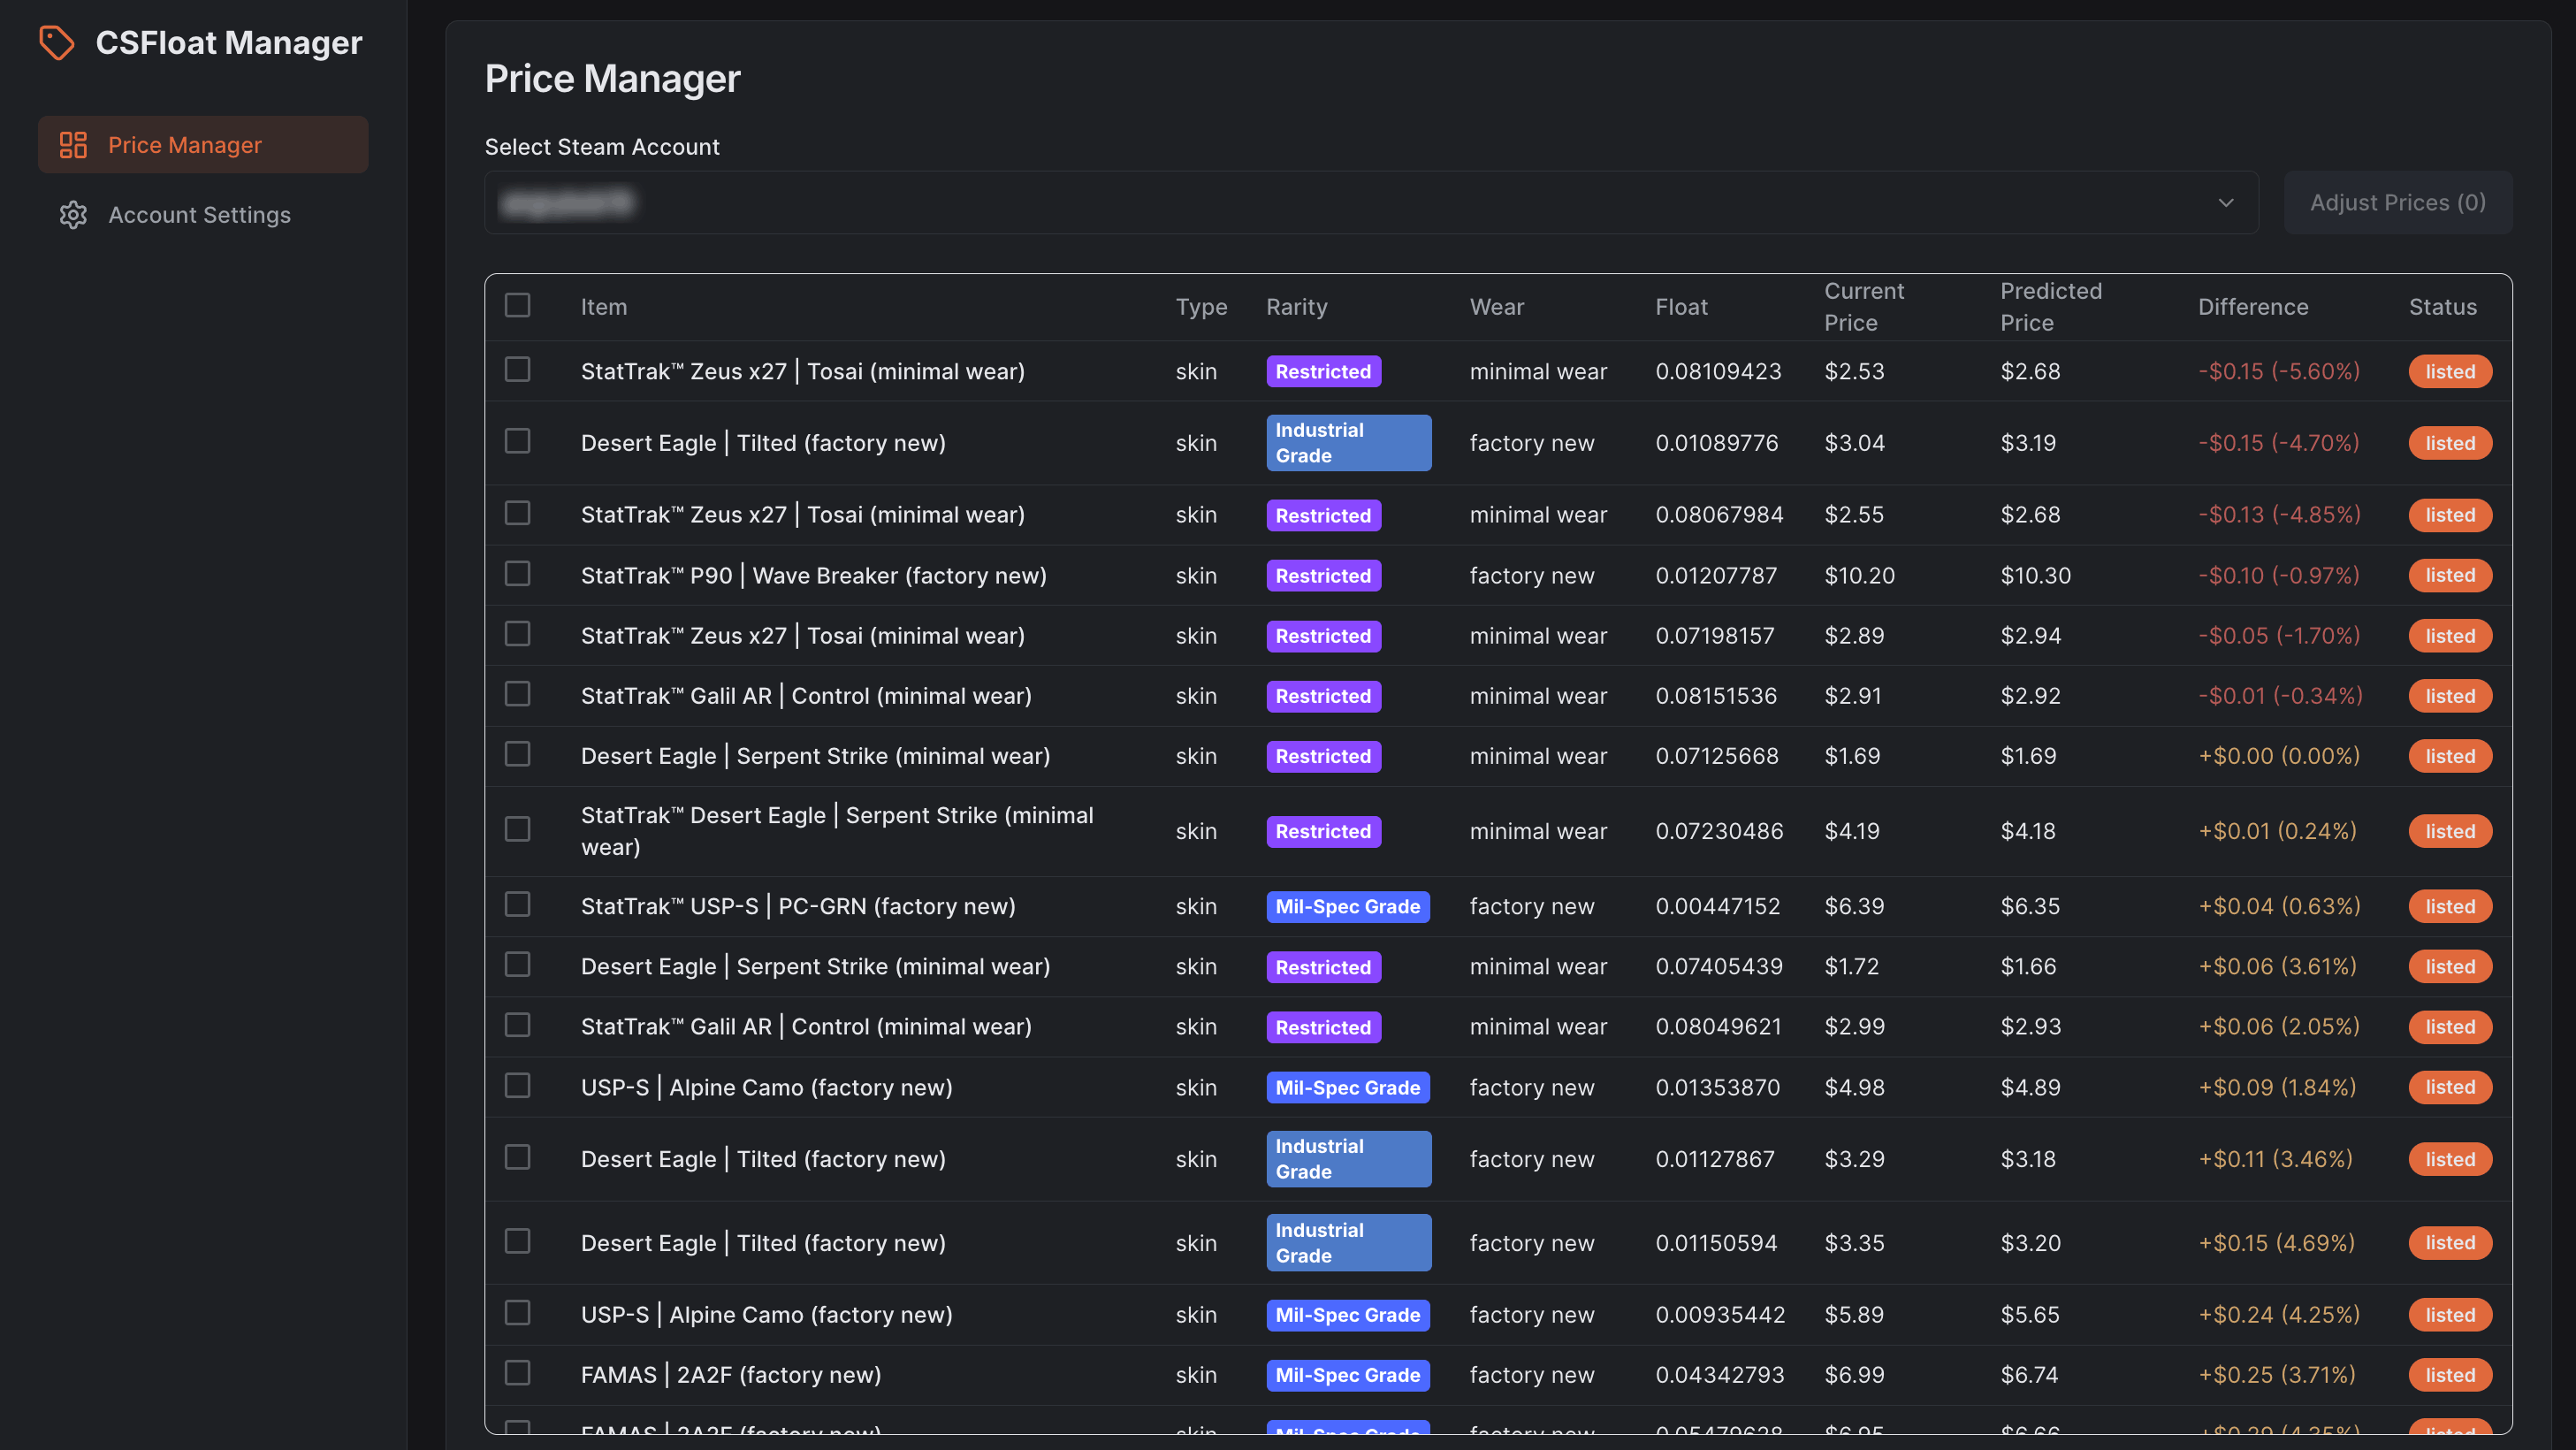
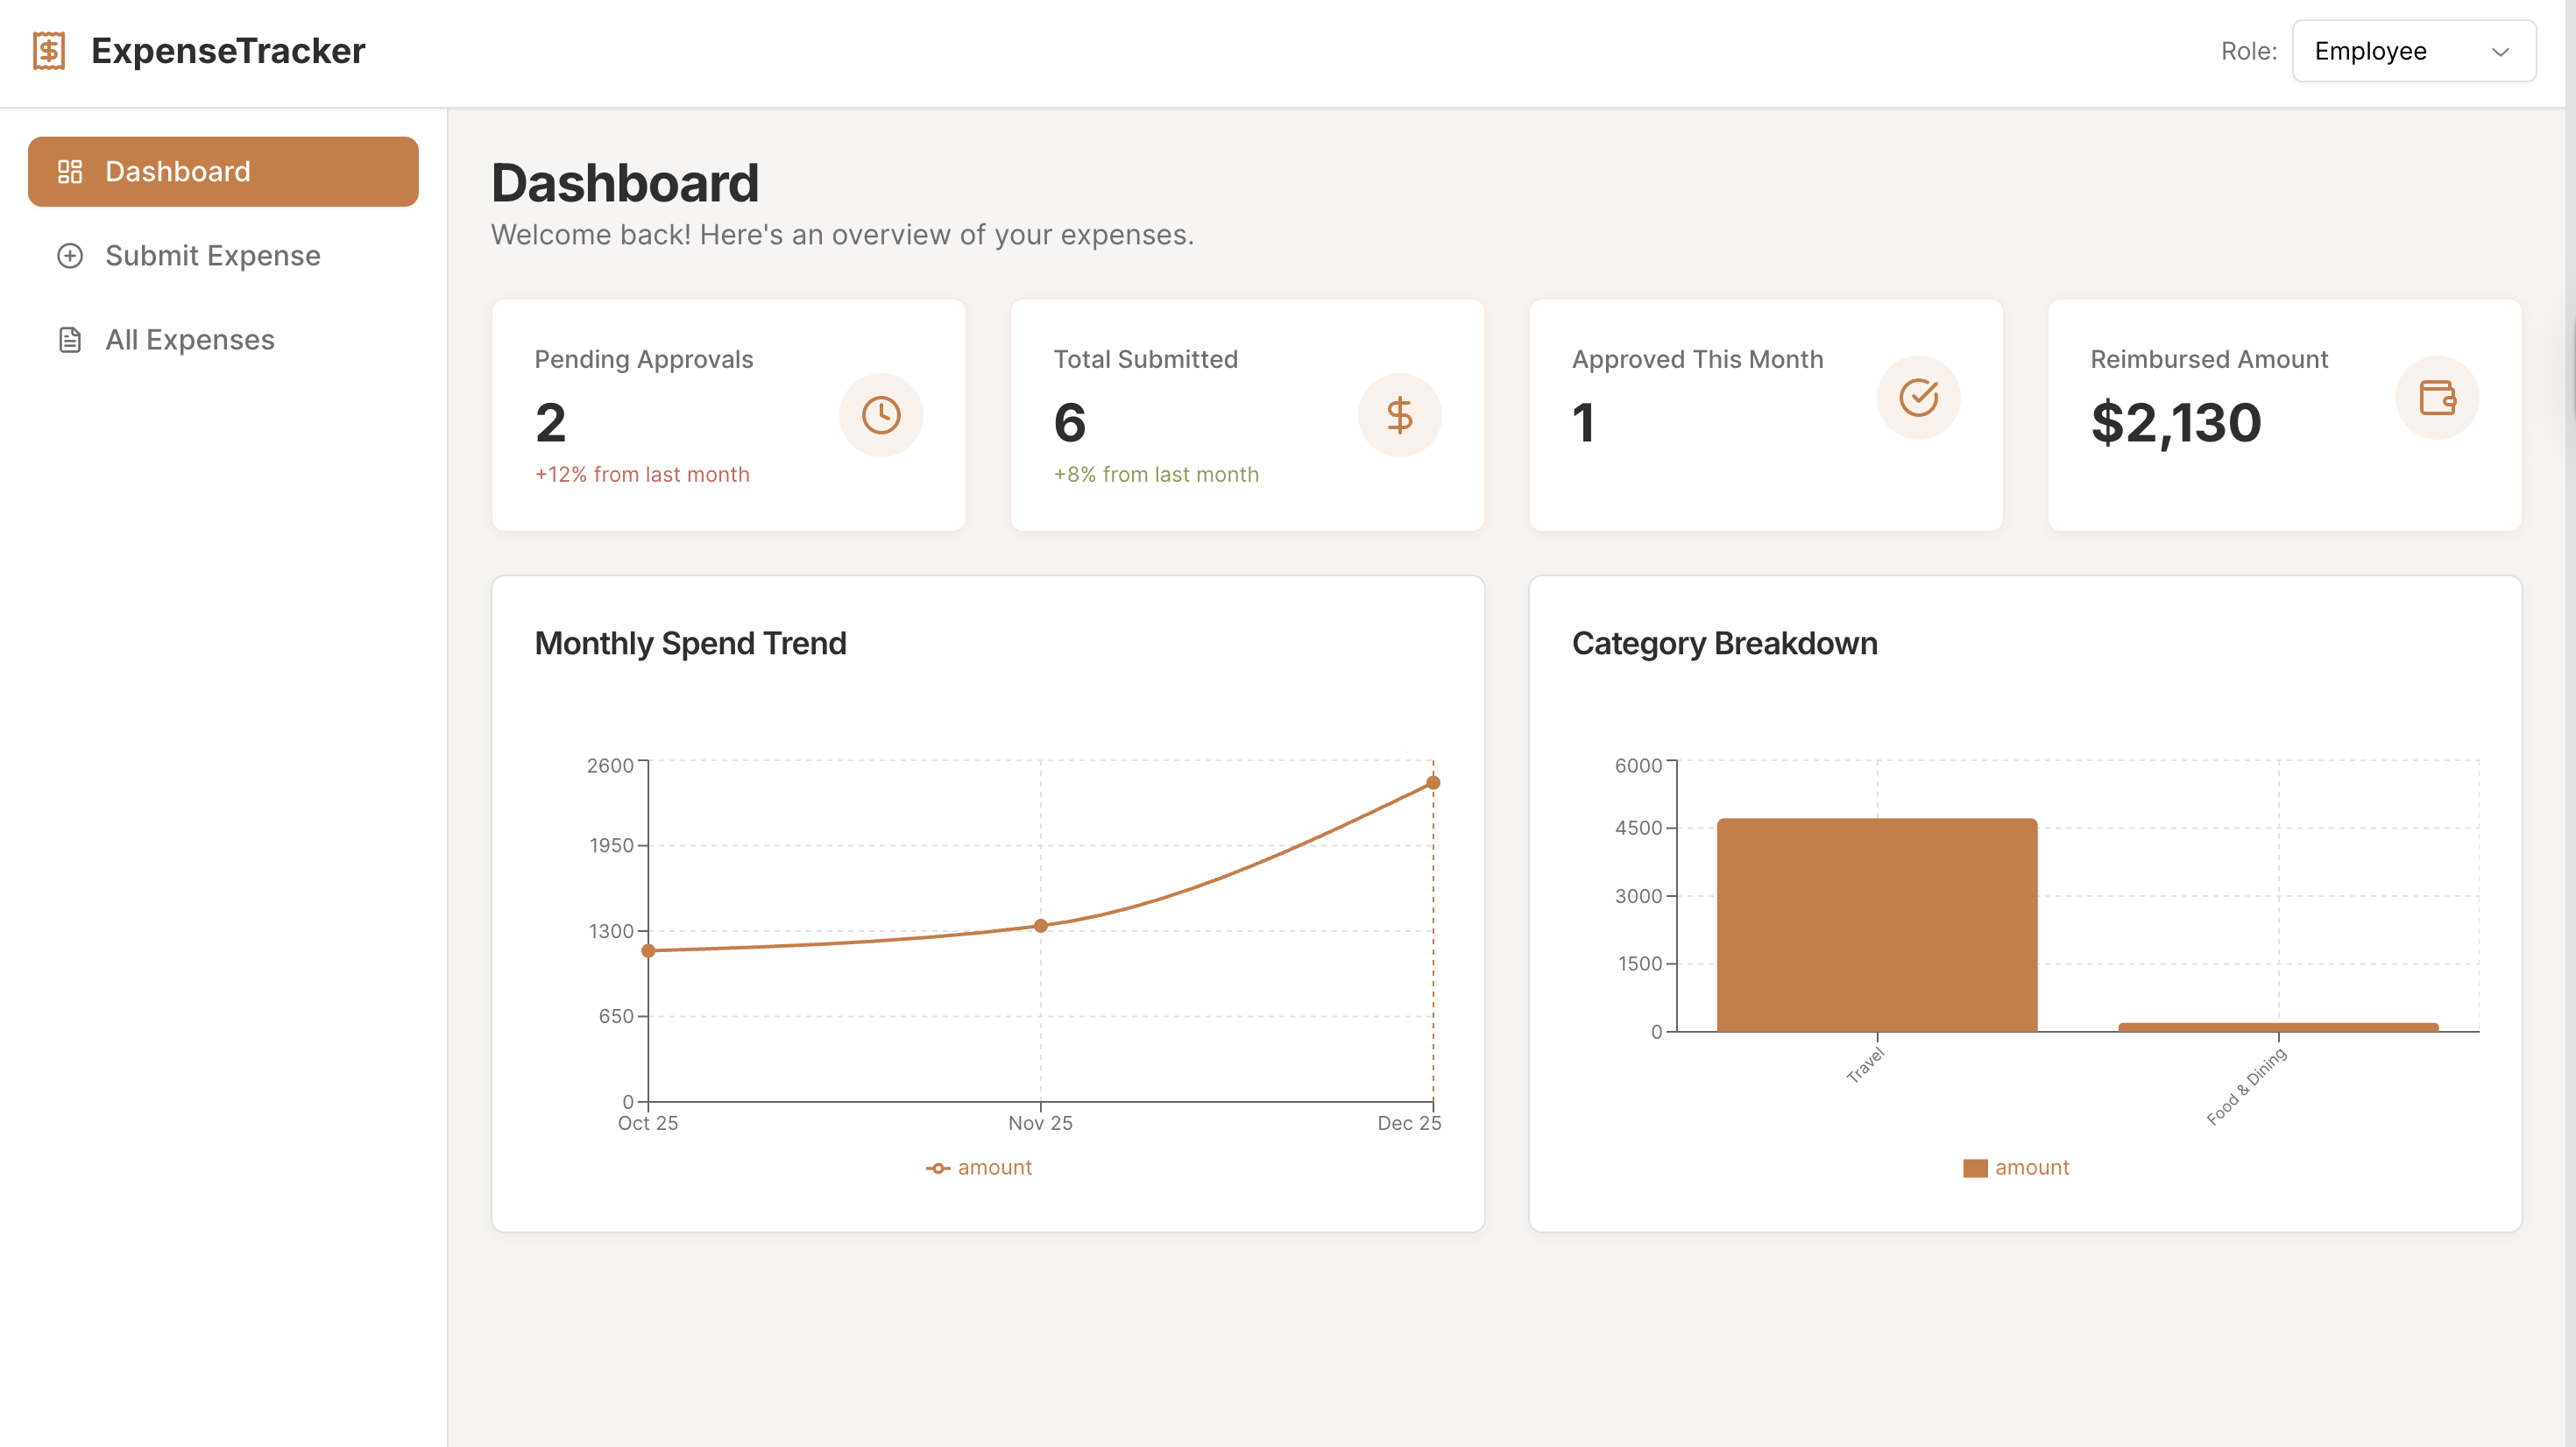
- User-friendly Interface with Interactive Data Visualization: Allows you to analyze your Exasol data, and make accurate, data-driven decisions.
- Powerful, Behind the Scene Exasol Analysis: Leverage powerful Exasol analytics without dealing with the intricacies of SQL queries. This dashboard automates the heavy lifting, freeing you to focus on gaining insights.
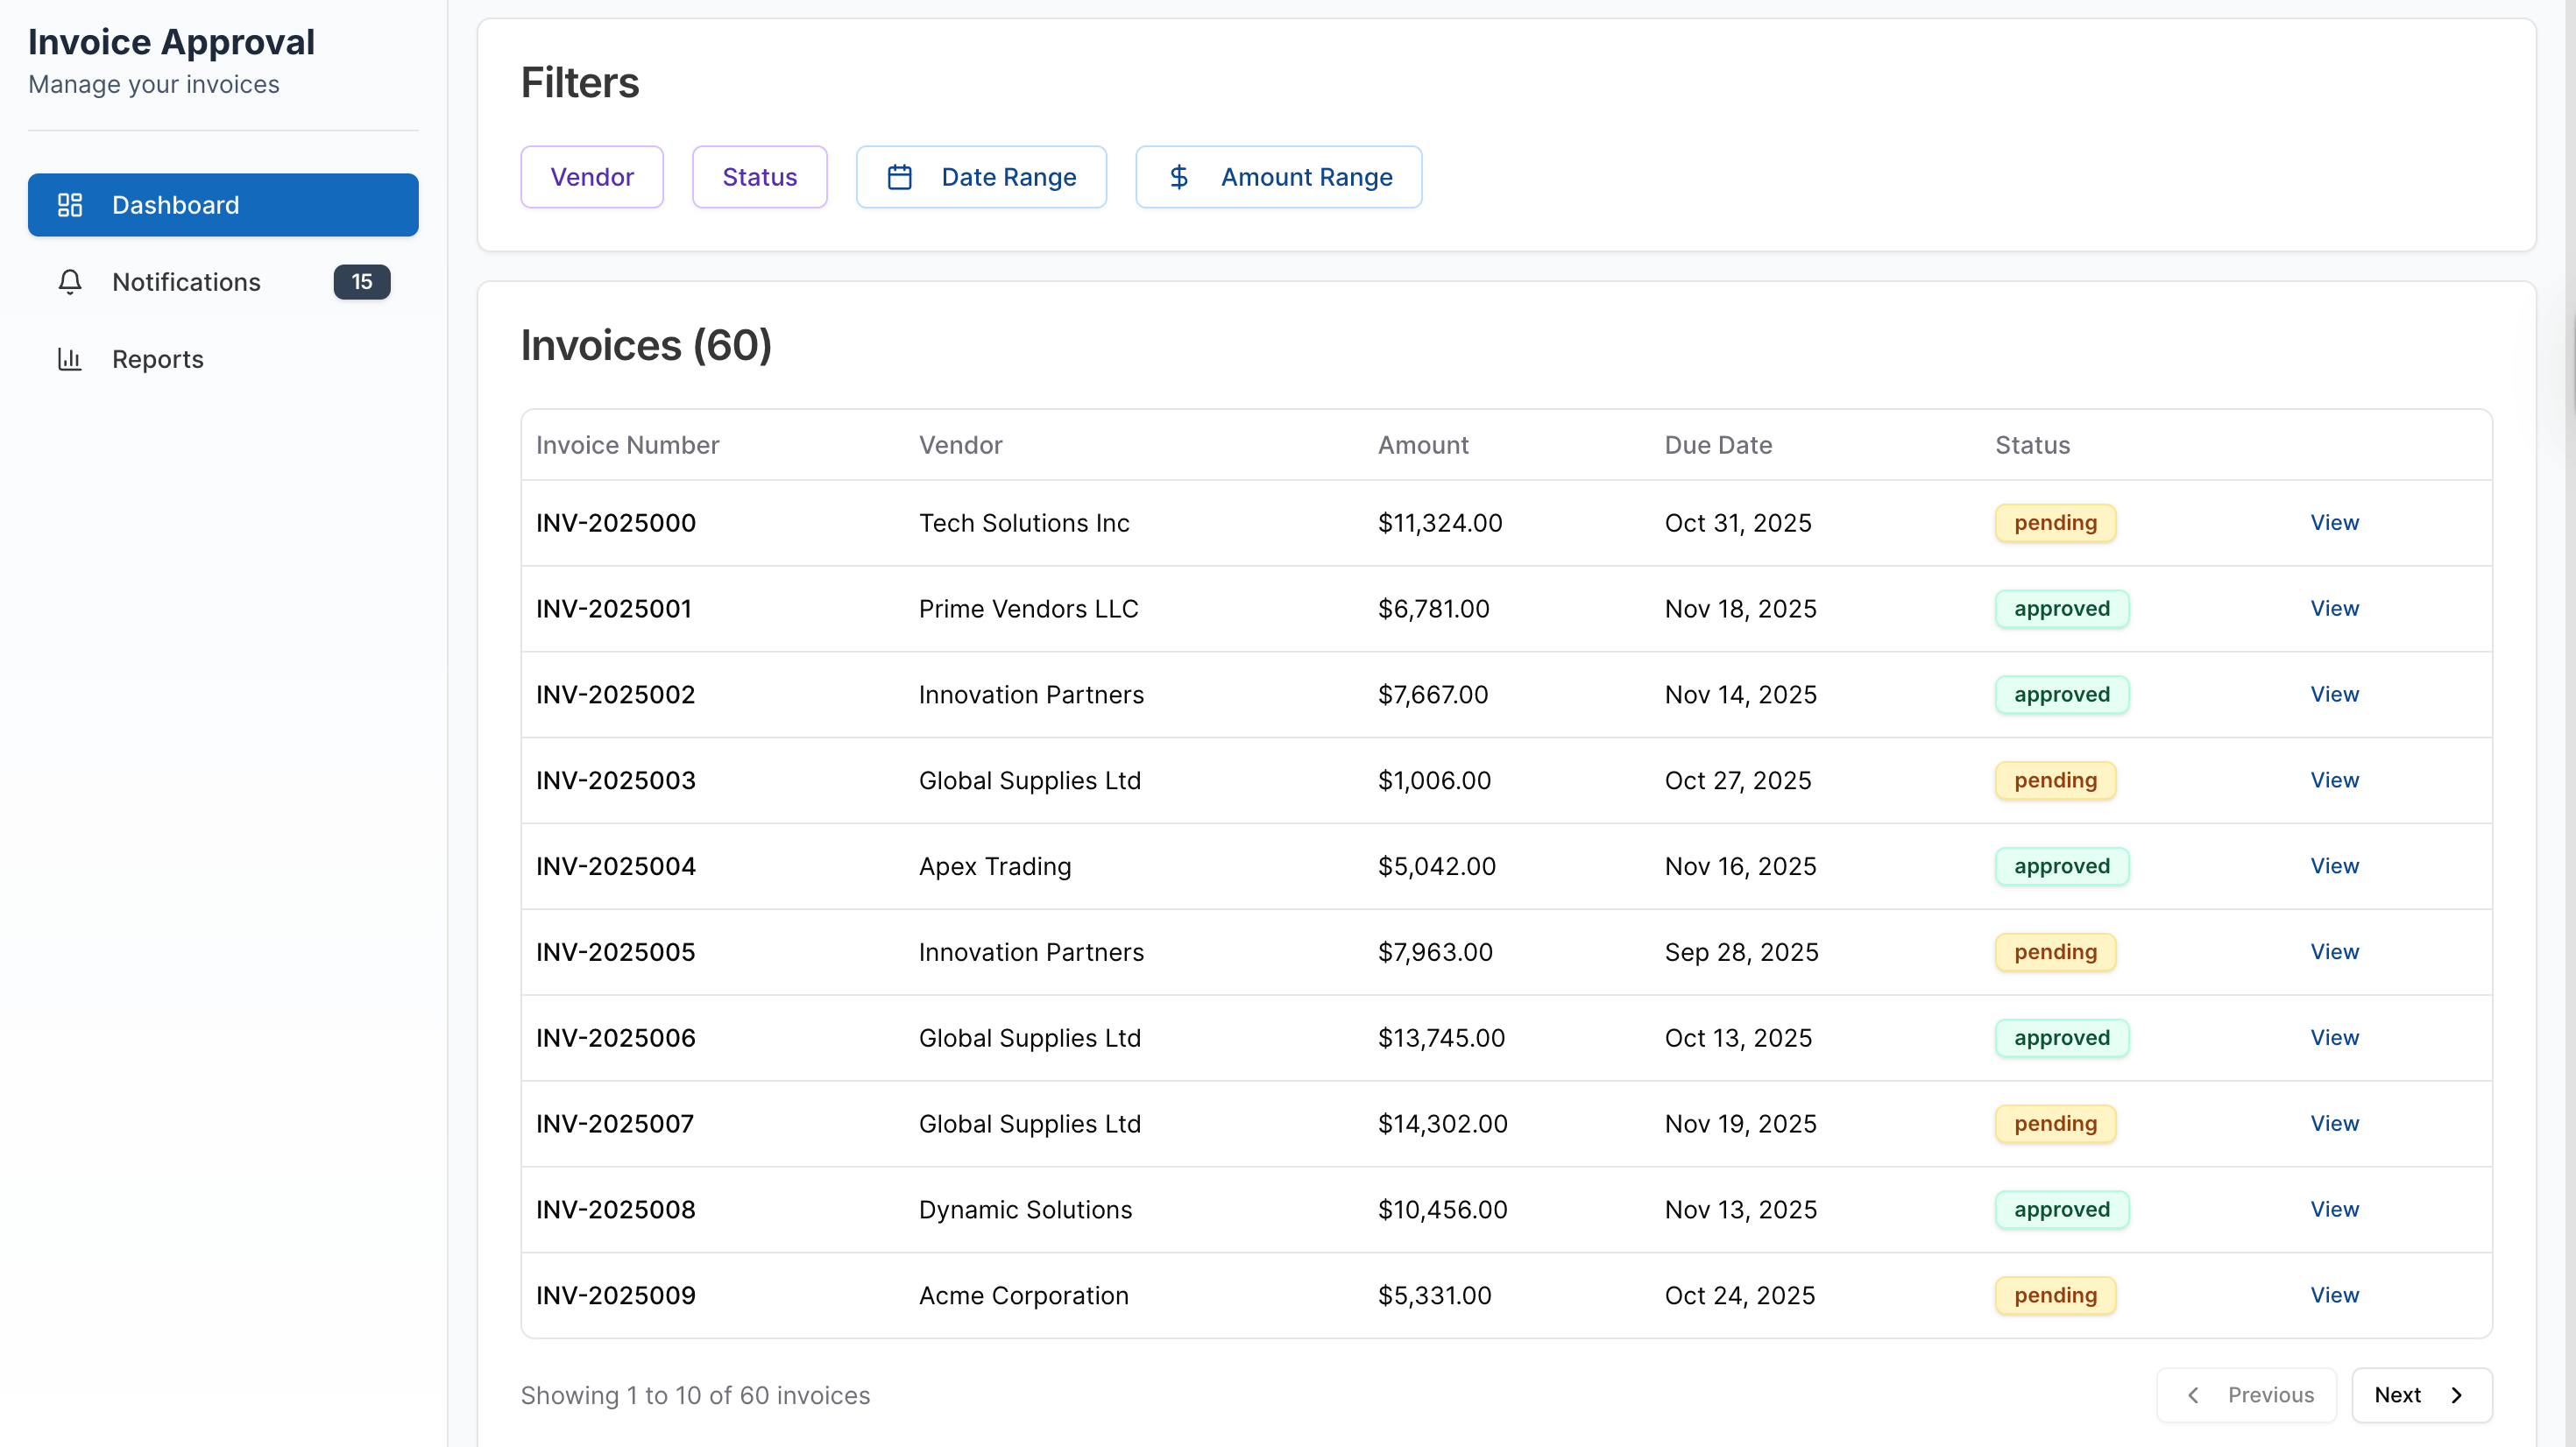
- Efficient Data Interaction Utility: The intuitive dashboard design facilitates easier drill-down into your data, enabling efficient data interaction and retrieval.
- Real-time Data Monitoring and Management: Stay updated with real-time data visuals that accurately reflect the current state of your business. This facilitates immediate responses to business shifts and trends.
Template integrations:
Template Solutions:
How does the Exasol Dashboard template work?
UI Bakery enables you to transform your data into dynamic internal tools, leveraging a combination of pre-built and customized components.
Try UI Bakery
- To initiate, click "Sign up".
- Establish your organization and create app "From template"
- Customize your generated application visually by intuitively dragging and dropping components and crafting queries for your resources.
- Expand the capabilities of this application by linking to your personal database, kickstarting the development of robust internal tools.
Exasol Dashboard related templates

Exasol Dashboard related templates

"The UI Bakery platform offers a cost-effective approach to creating applications. With UI Bakery, you can achieve your app development goals without breaking the bank."

"Before switching to UI Bakery we developed a number of apps within the Retool system. The Retool system was good but ultimately did not have the flexibility and feature sets that we required."
Check the Story