Data Integration Dashboard

Overview
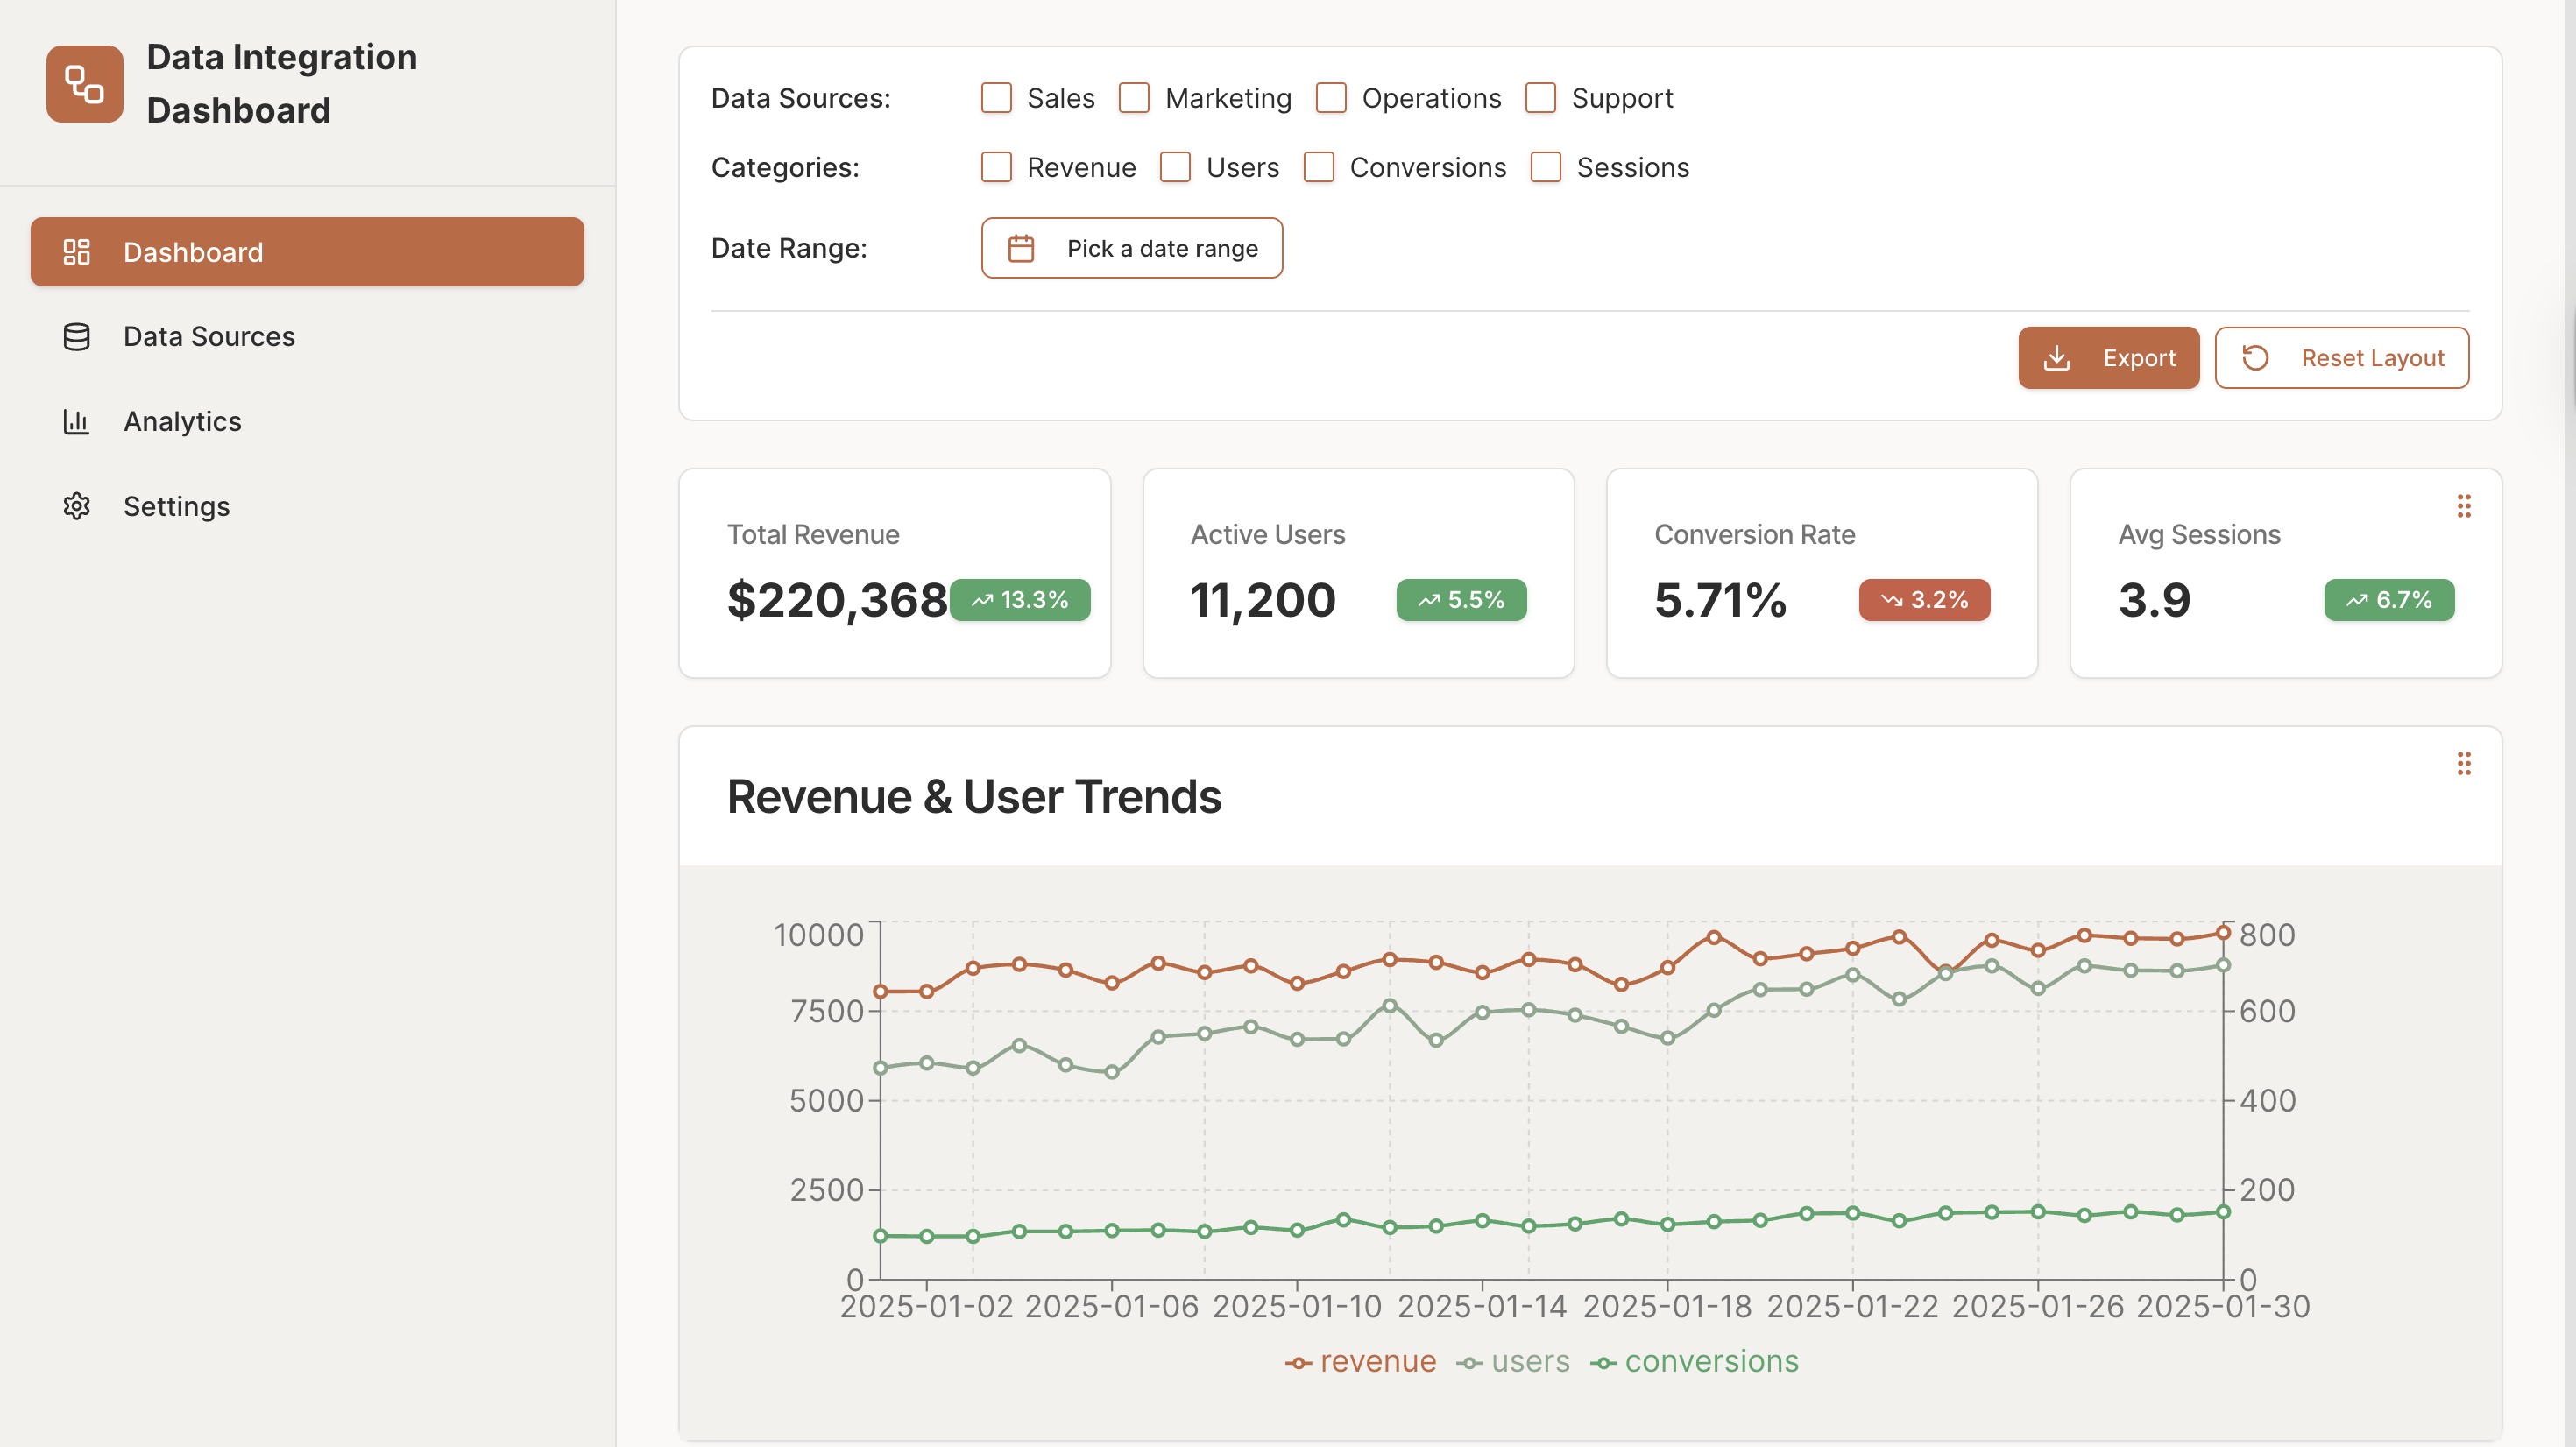
Centralize and visualize data from multiple sources in one interactive platform.
The Data Integration Dashboard allows teams to monitor business metrics, analyze trends, and manage data sources efficiently with responsive charts, KPIs, and a customizable layout.
Key Features
Multi-Source Data Monitoring & Visualization
Integrate multiple data sources and visualize trends with interactive charts & KPIs. Quickly identify performance patterns and make informed decisions.
Customizable Dashboard Layout & Drag-and-Drop
Tailor your workspace by rearranging widgets and panels. Highlight the metrics most relevant to your business workflow.
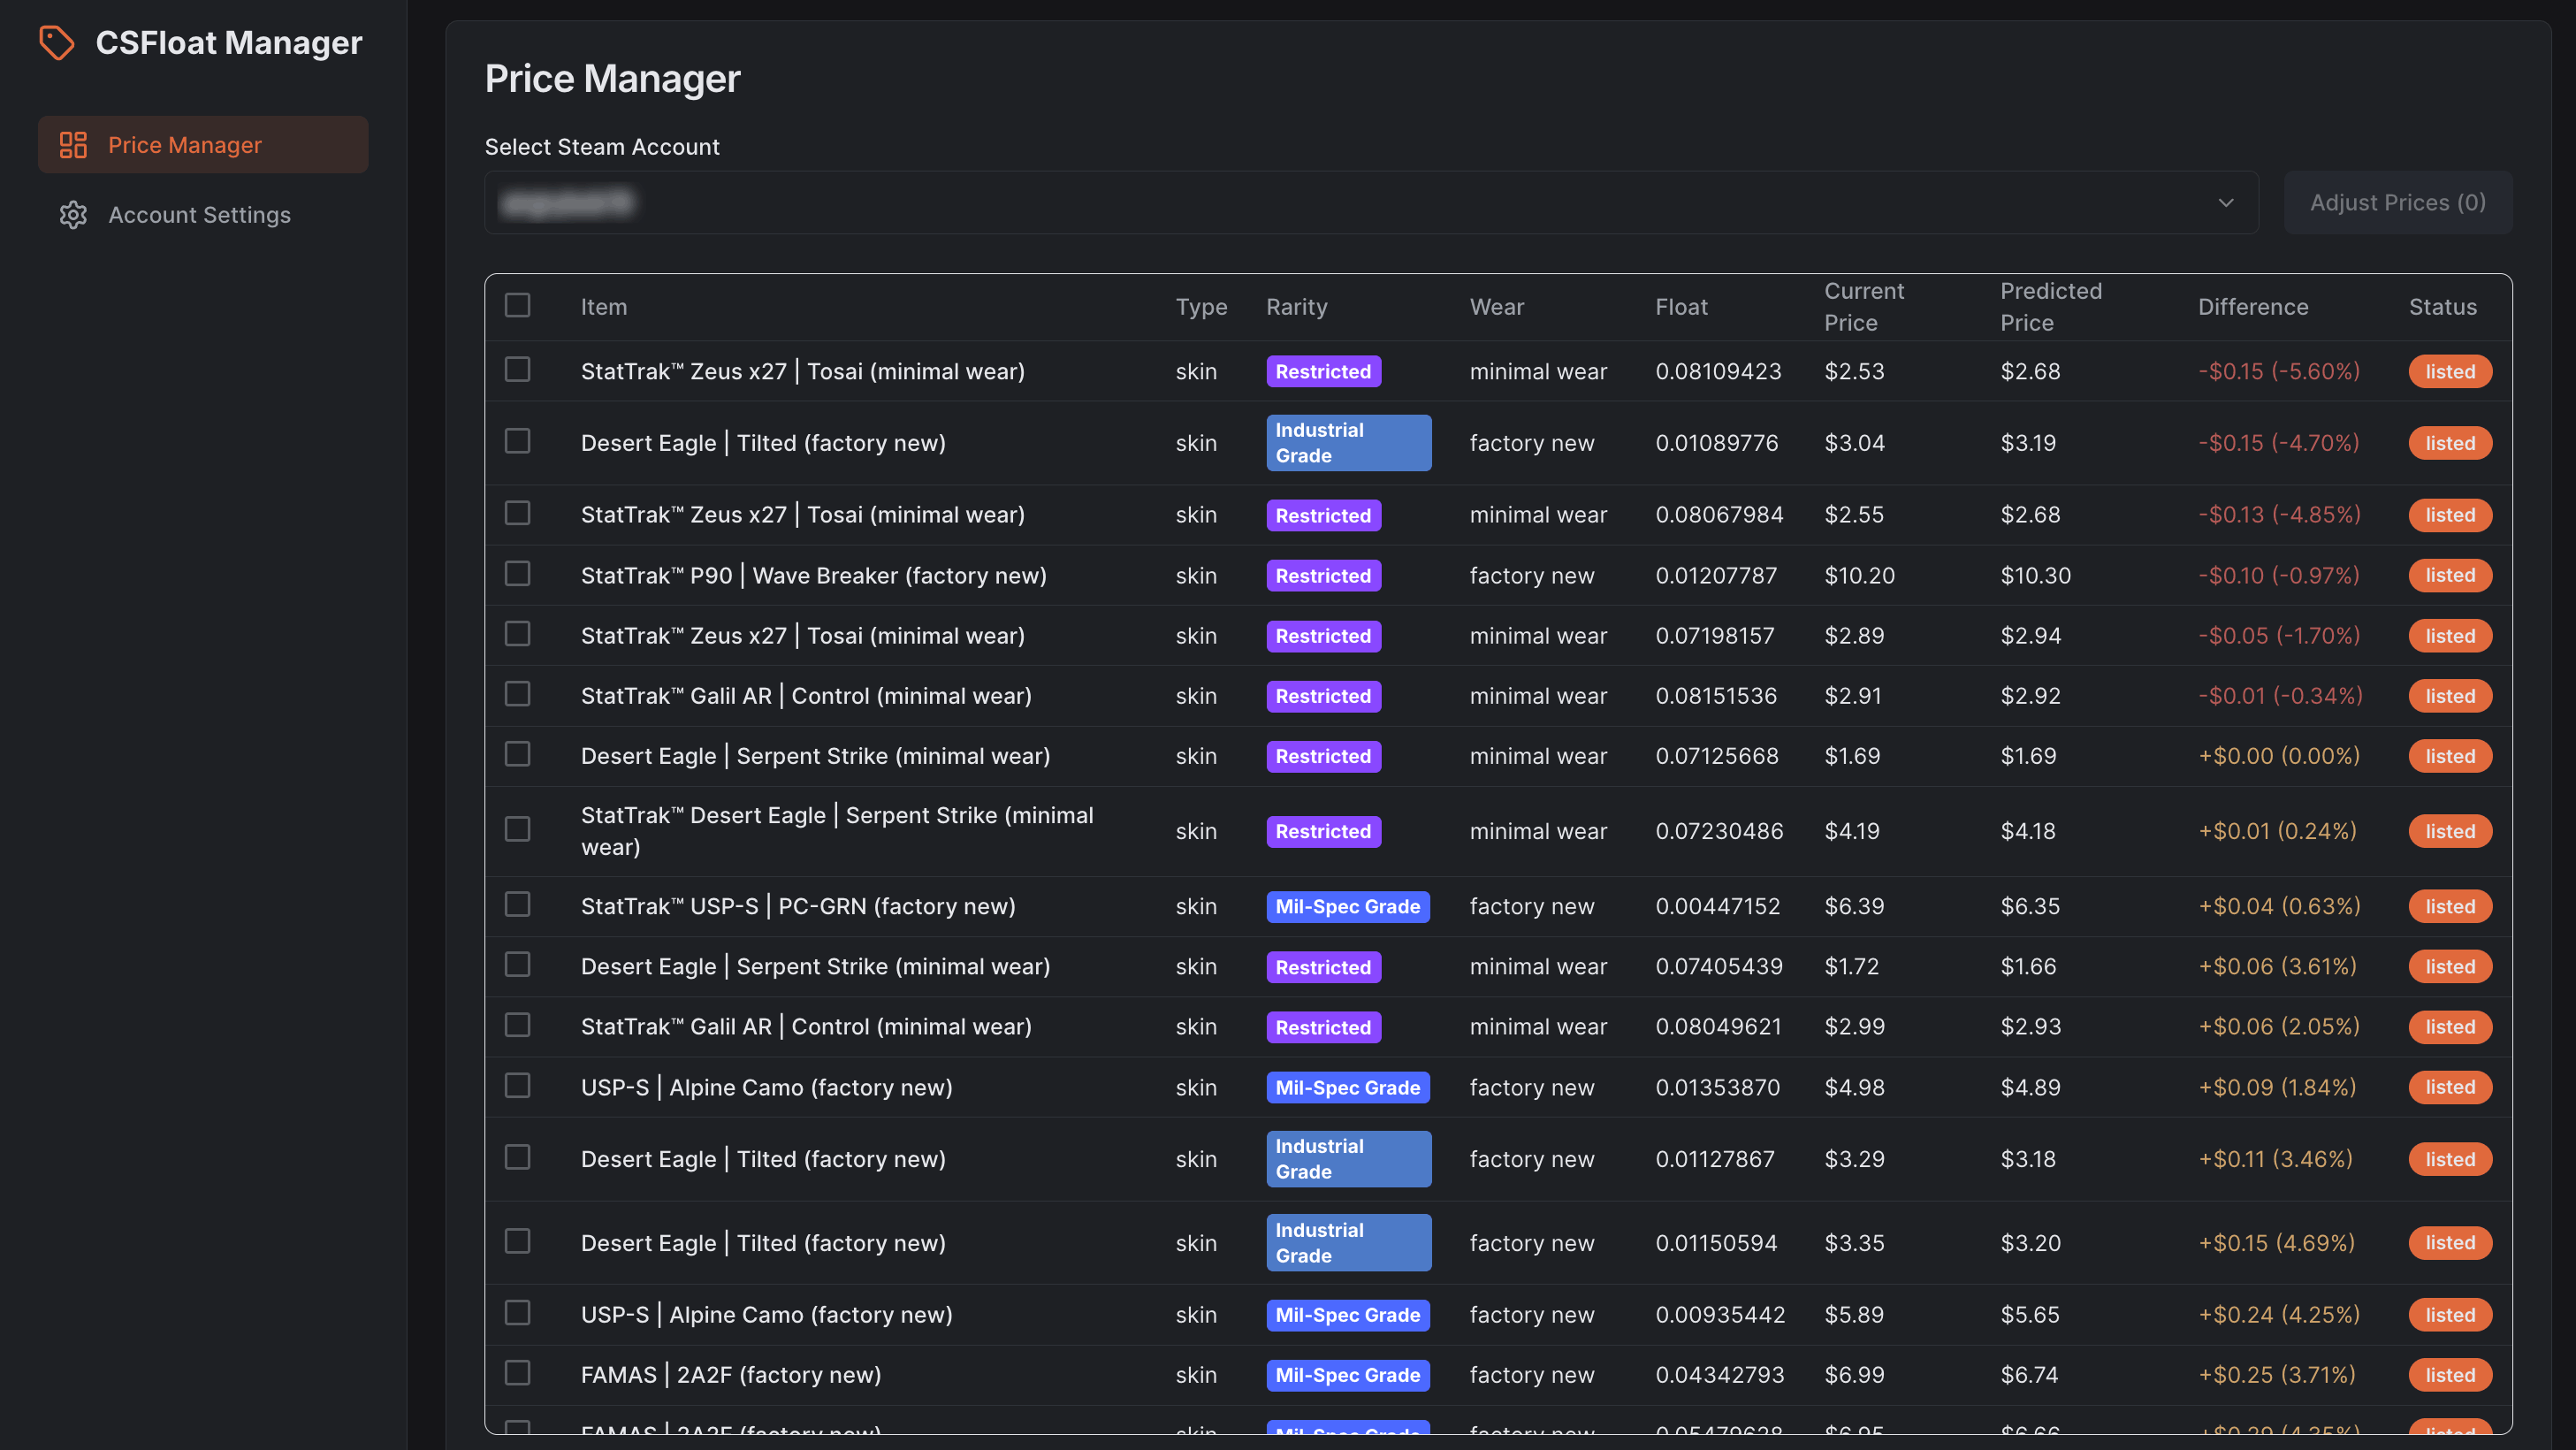
Advanced Filtering & Data Exploration
Filter data by source, category, or date range to drill down into specific insights and understand performance across different dimensions.
Settings & Data Source Management
Configure and manage your connected data sources with options for refresh intervals, default views, and alerts to stay on top of changes.
Performance Analytics & Summary Metrics
Track core KPIs including revenue, users, conversions, and sessions, with visual summaries to monitor business health and trends over time.
Use Cases
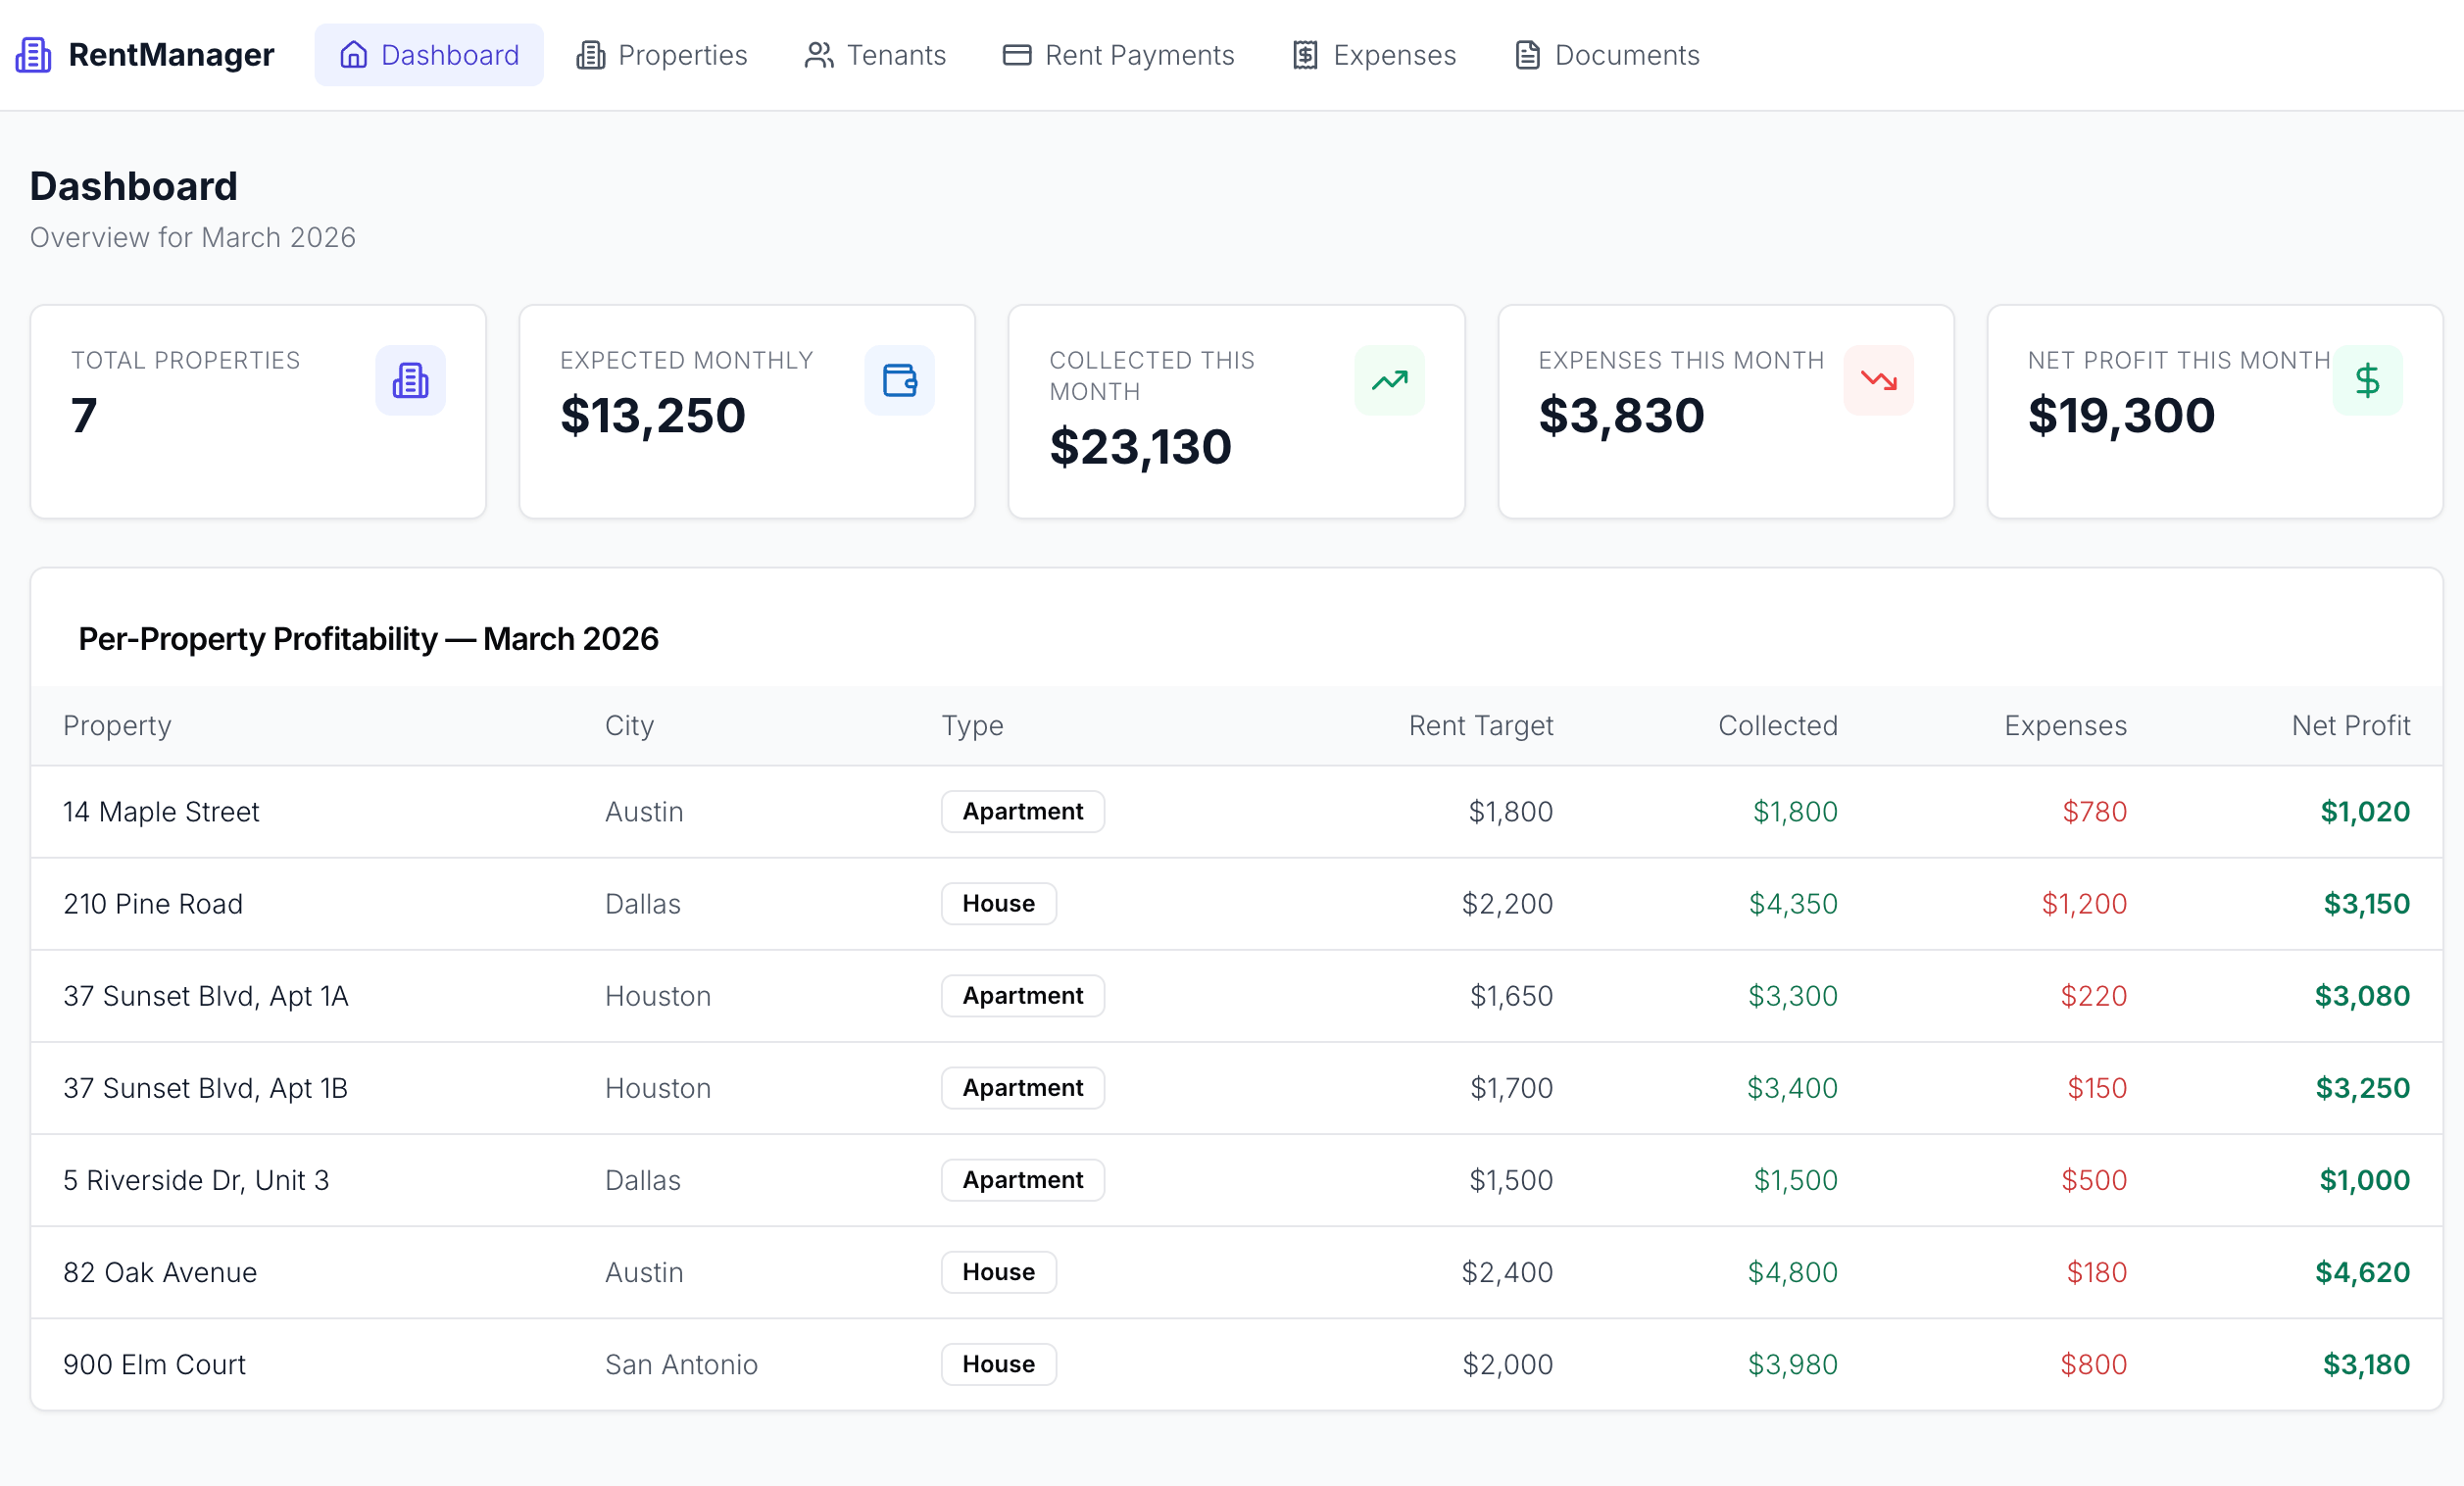
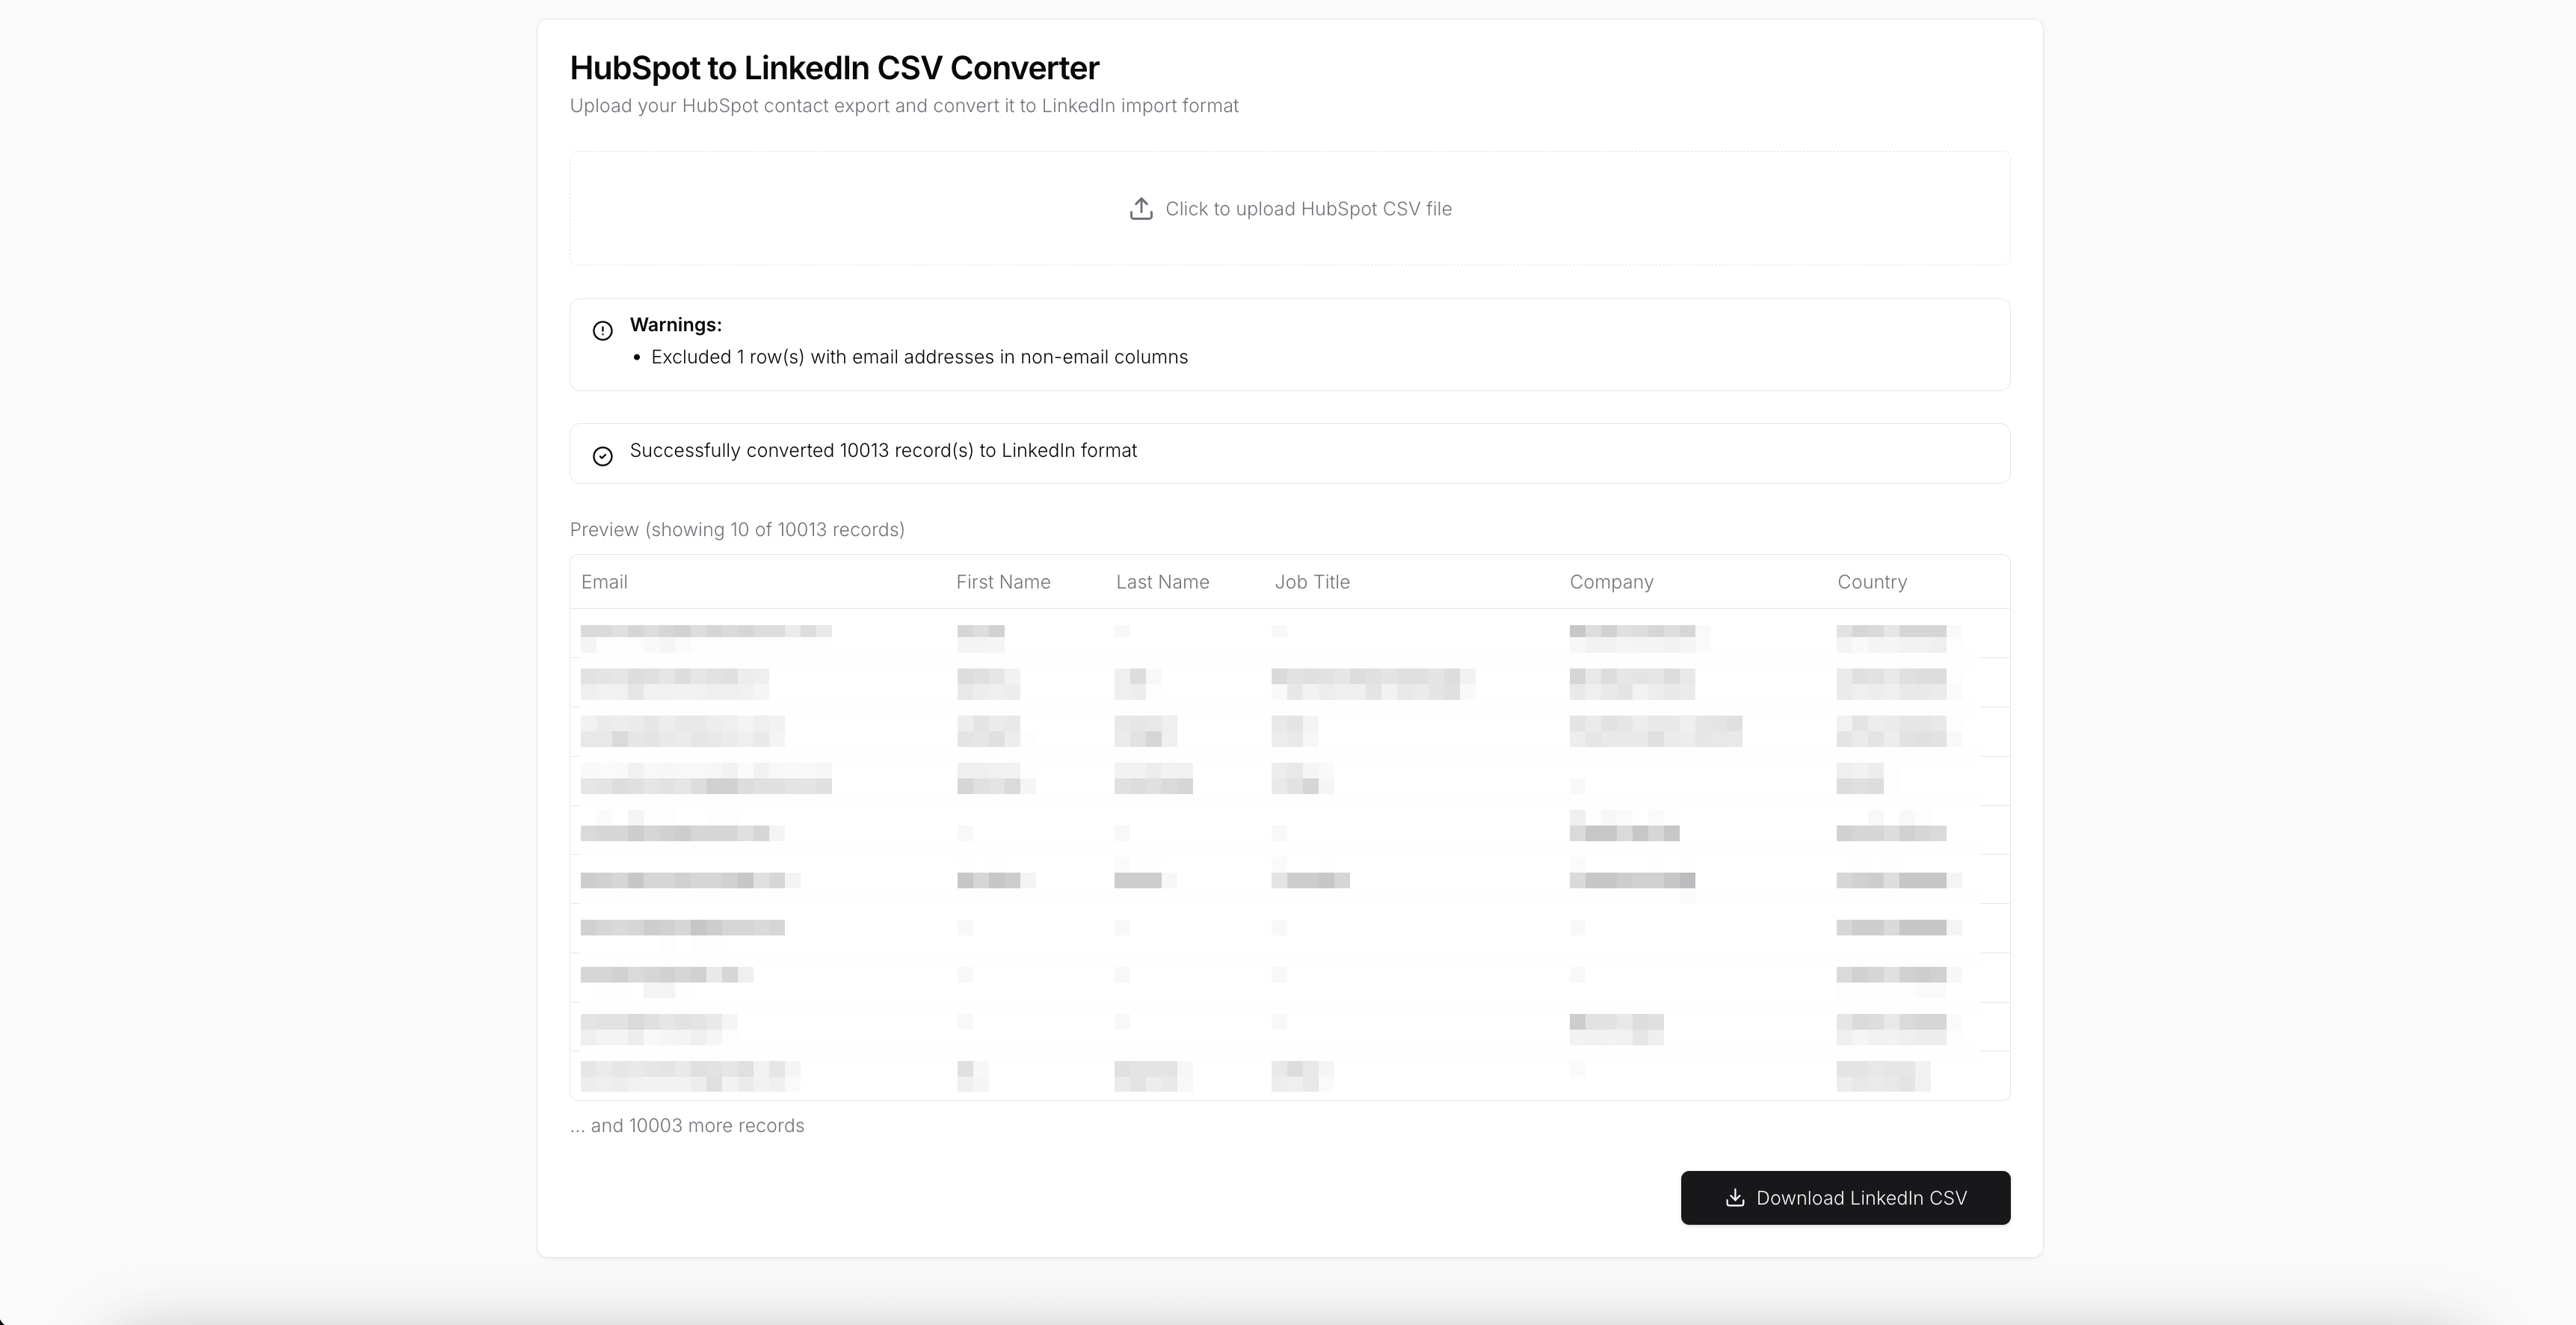
- Business analytics dashboards consolidating multiple data sources
- Operational monitoring across sales, marketing, and support teams
- Real-time insights for executive reporting & decision-making
- Data exploration hubs for performance tracking and trend analysis
Start Building Your Own Data Integration Dashboard
Use this Data Integration Dashboard template as a foundation to build a fully custom analytics platform. Connect multiple data sources, visualize KPIs, explore trends, and configure dashboards tailored to your business workflow with UI Bakery’s low-code tools.
Insights into how our Data Integration Dashboard template operates
UI Bakery enables you to transform your data into dynamic internal tools, leveraging a combination of pre-built and customized components.
- To initiate, click "Sign up".
- Establish your organization and create app "From template"
- Customize your generated application visually by intuitively dragging and dropping components and crafting queries for your resources.
- Expand the capabilities of this application by linking to your personal database, kickstarting the development of robust internal tools.
Related Data Integration Dashboard templates


Related Data Integration Dashboard templates

"The UI Bakery platform offers a cost-effective approach to creating applications. With UI Bakery, you can achieve your app development goals without breaking the bank."
