Supabase Admin Dashboard

Overview
Monitor your Supabase database, users, subscriptions, and revenue with a professional, intuitive interface.
The Supabase Admin Dashboard centralizes key metrics, analytics, and record views in one interactive platform, providing developers, database administrators, and data engineers with a clear, actionable overview of system performance.
Key Features
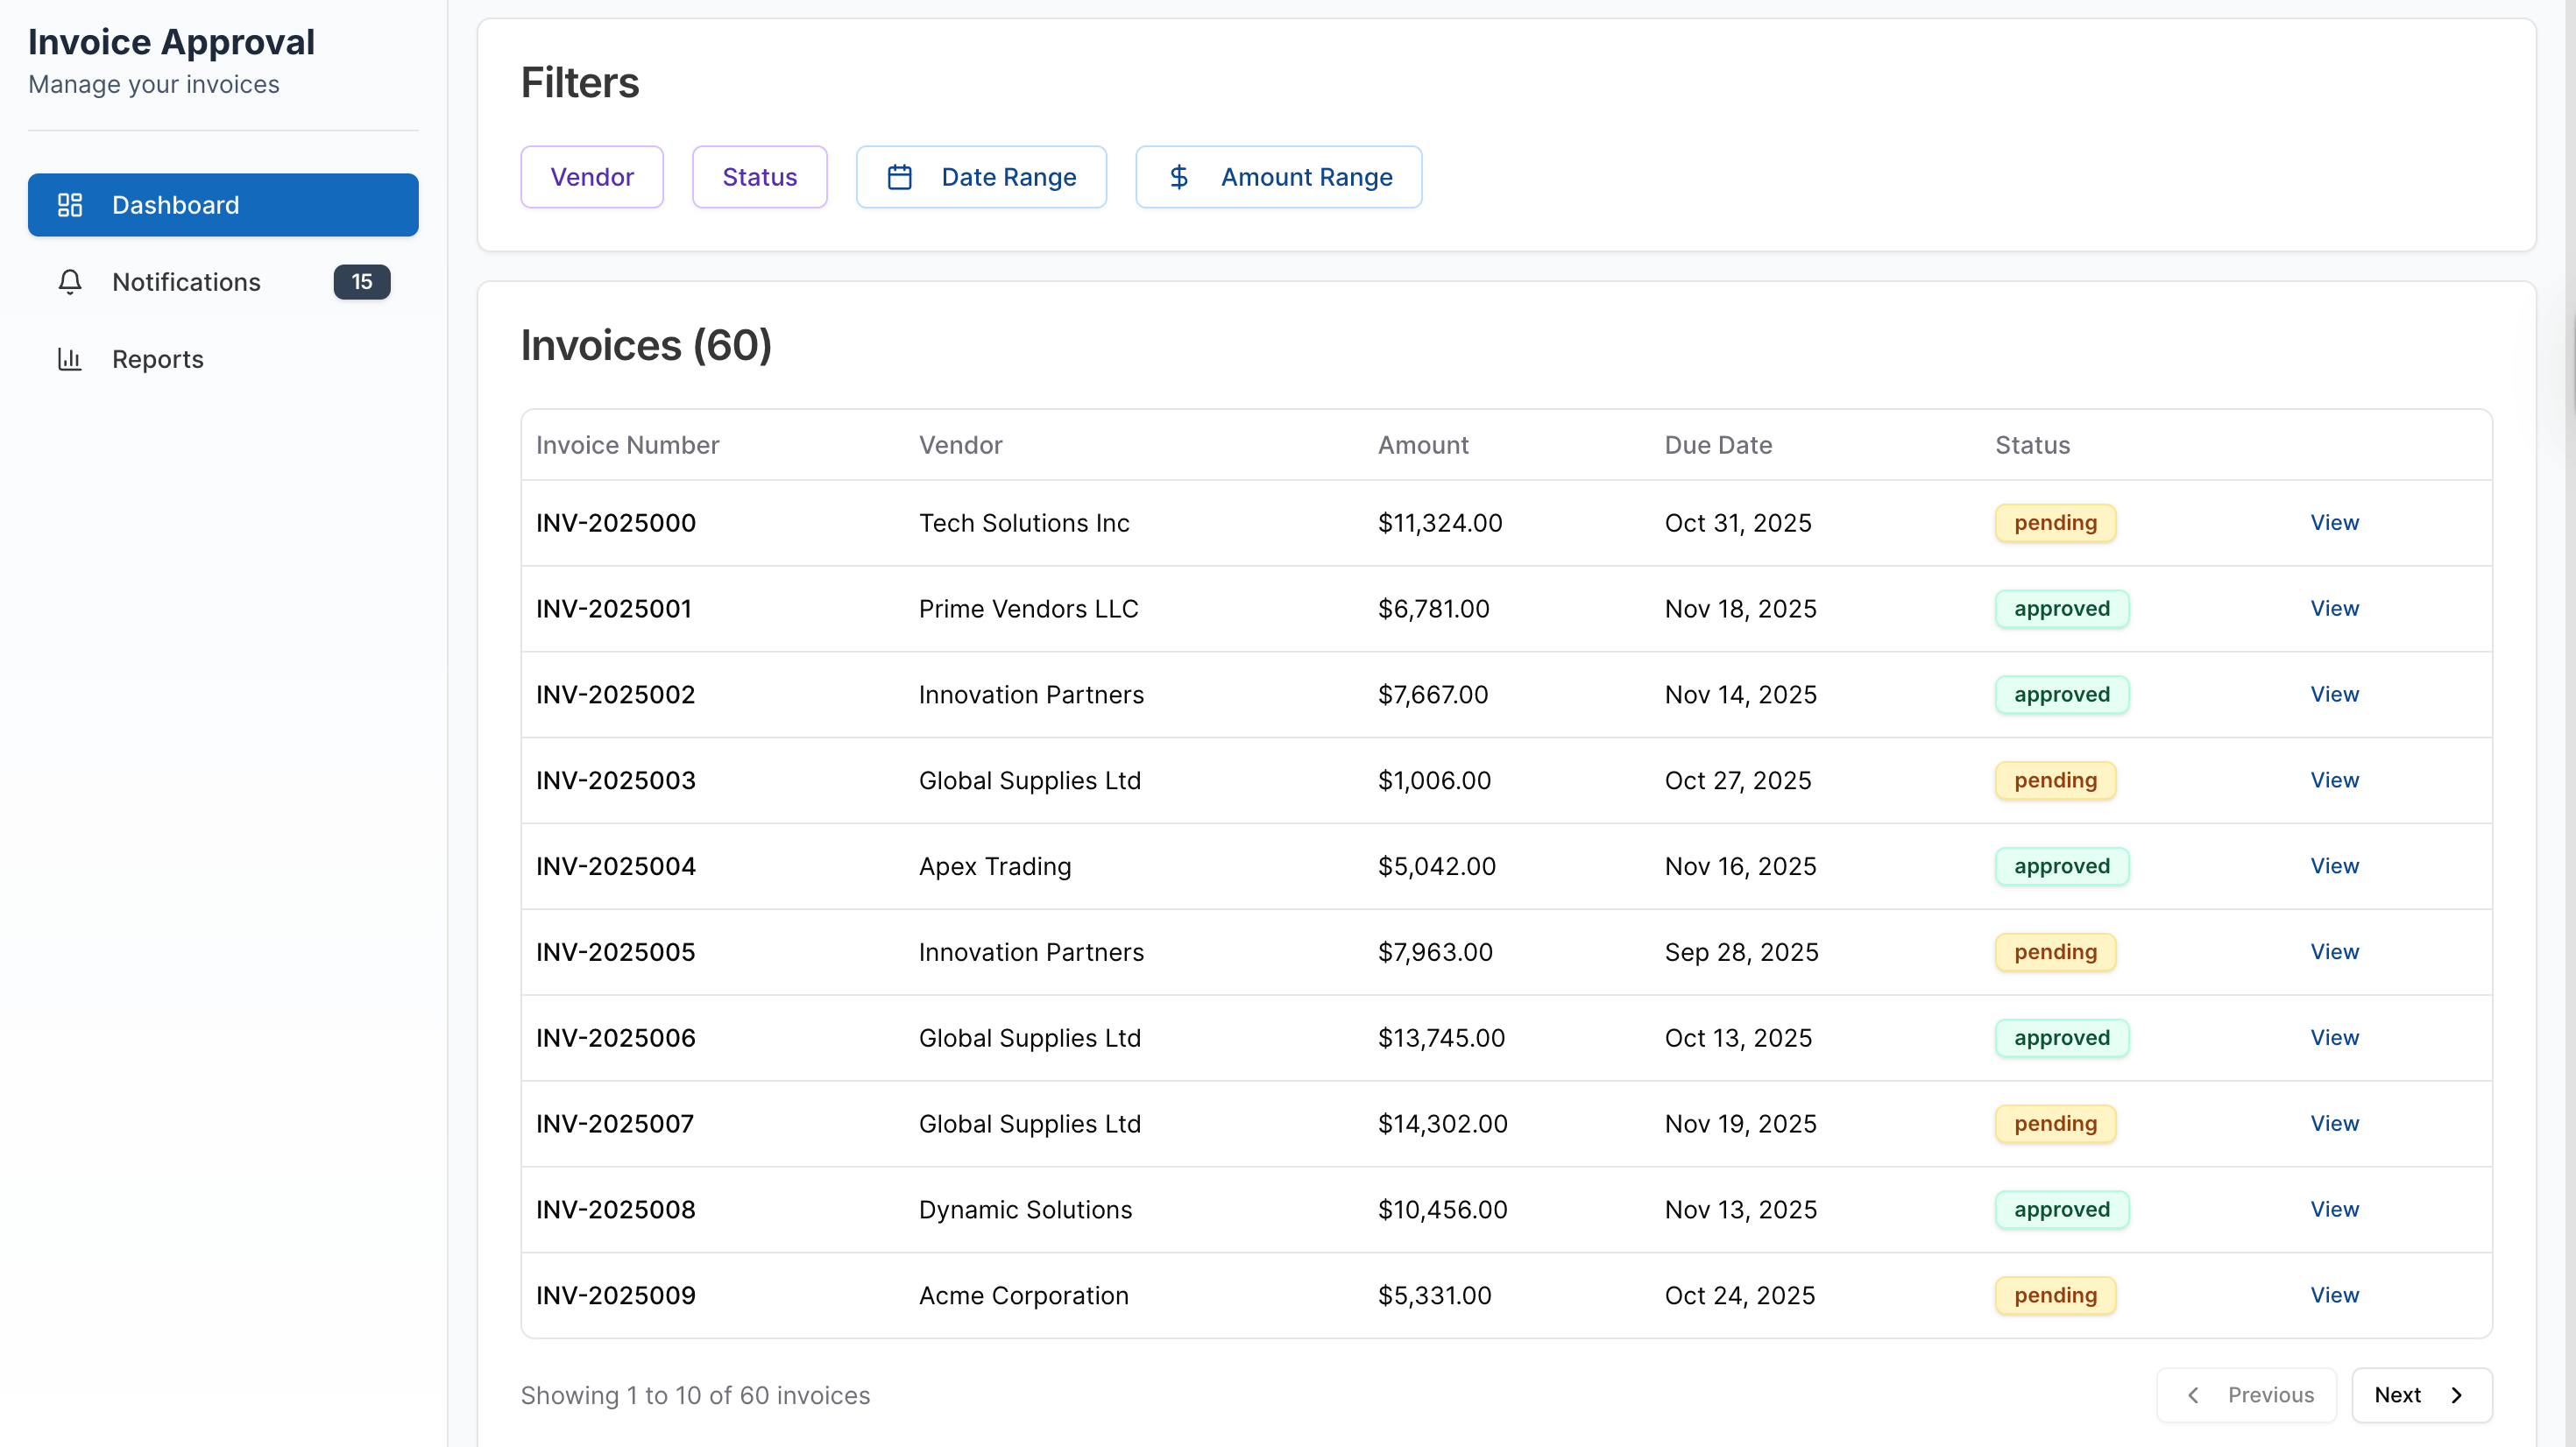
User & Record Management
View detailed user profiles, subscription statuses, and database records in sortable, searchable tables. Access full record details via row panels for a complete overview of your data.
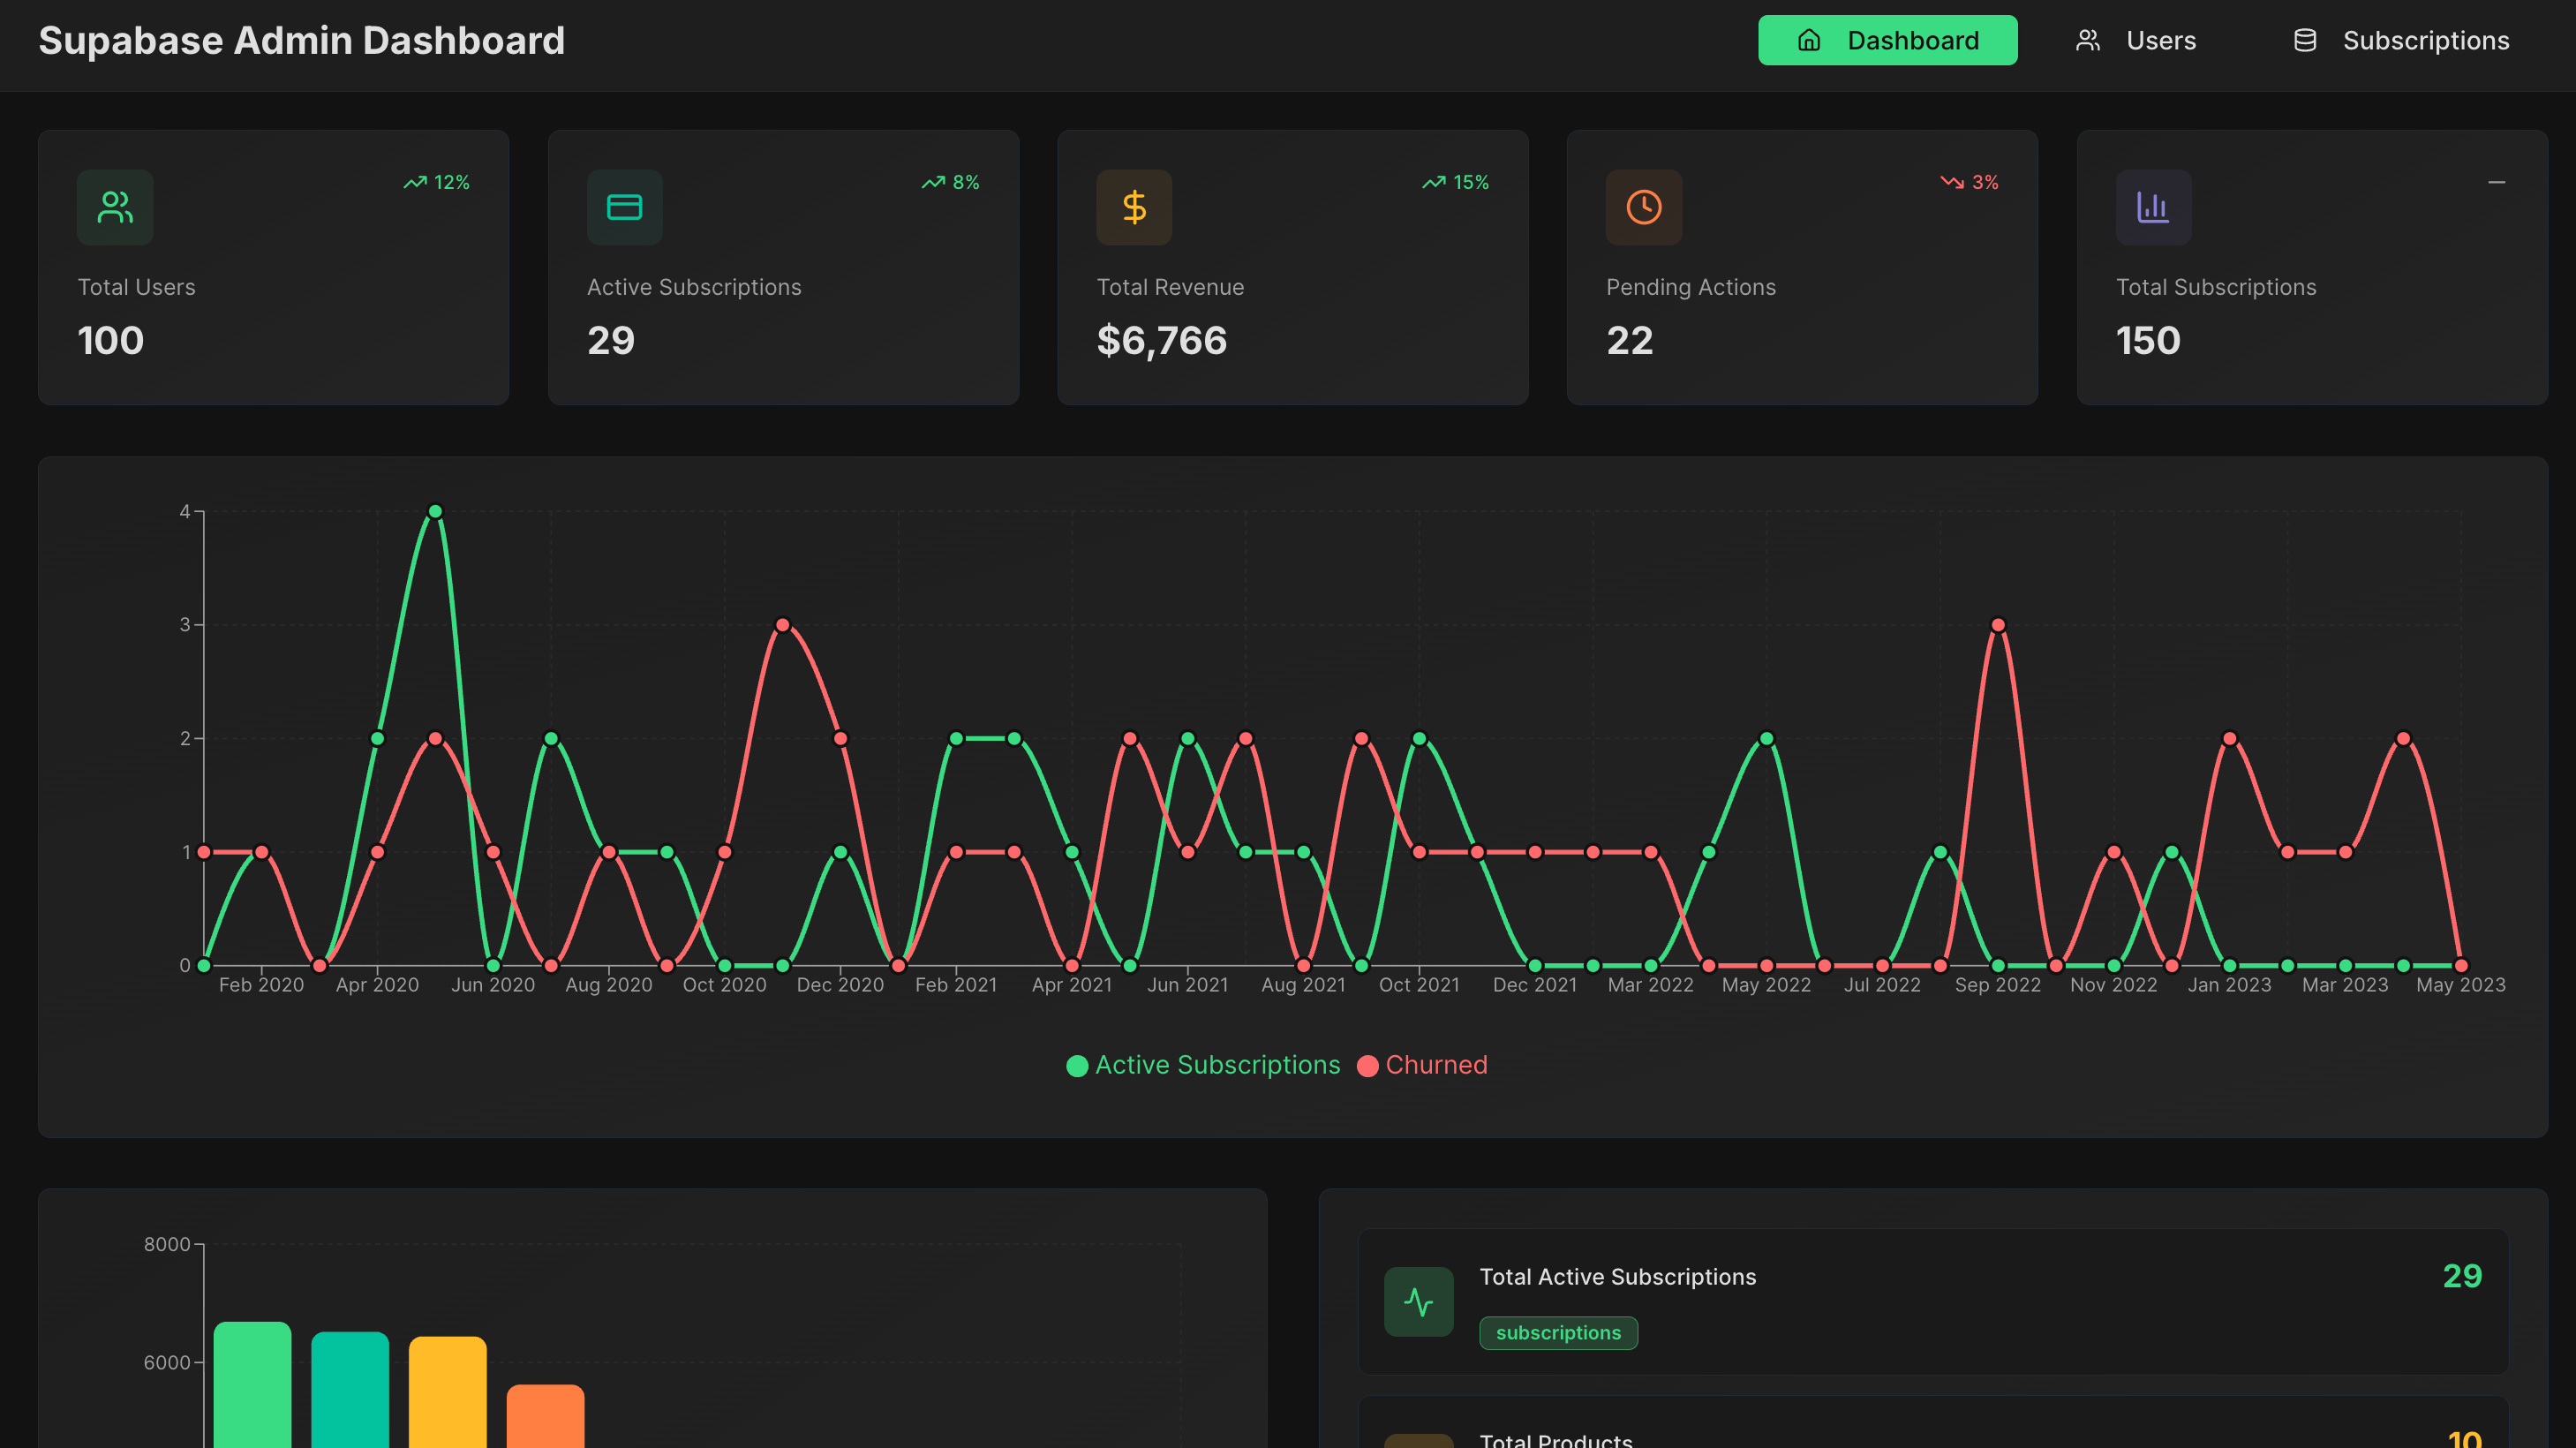
Subscription & Revenue Analytics
Track active subscriptions, churn, product performance, and revenue trends through dynamic charts and summary cards. Monitor subscription timelines and product usage patterns at a glance.
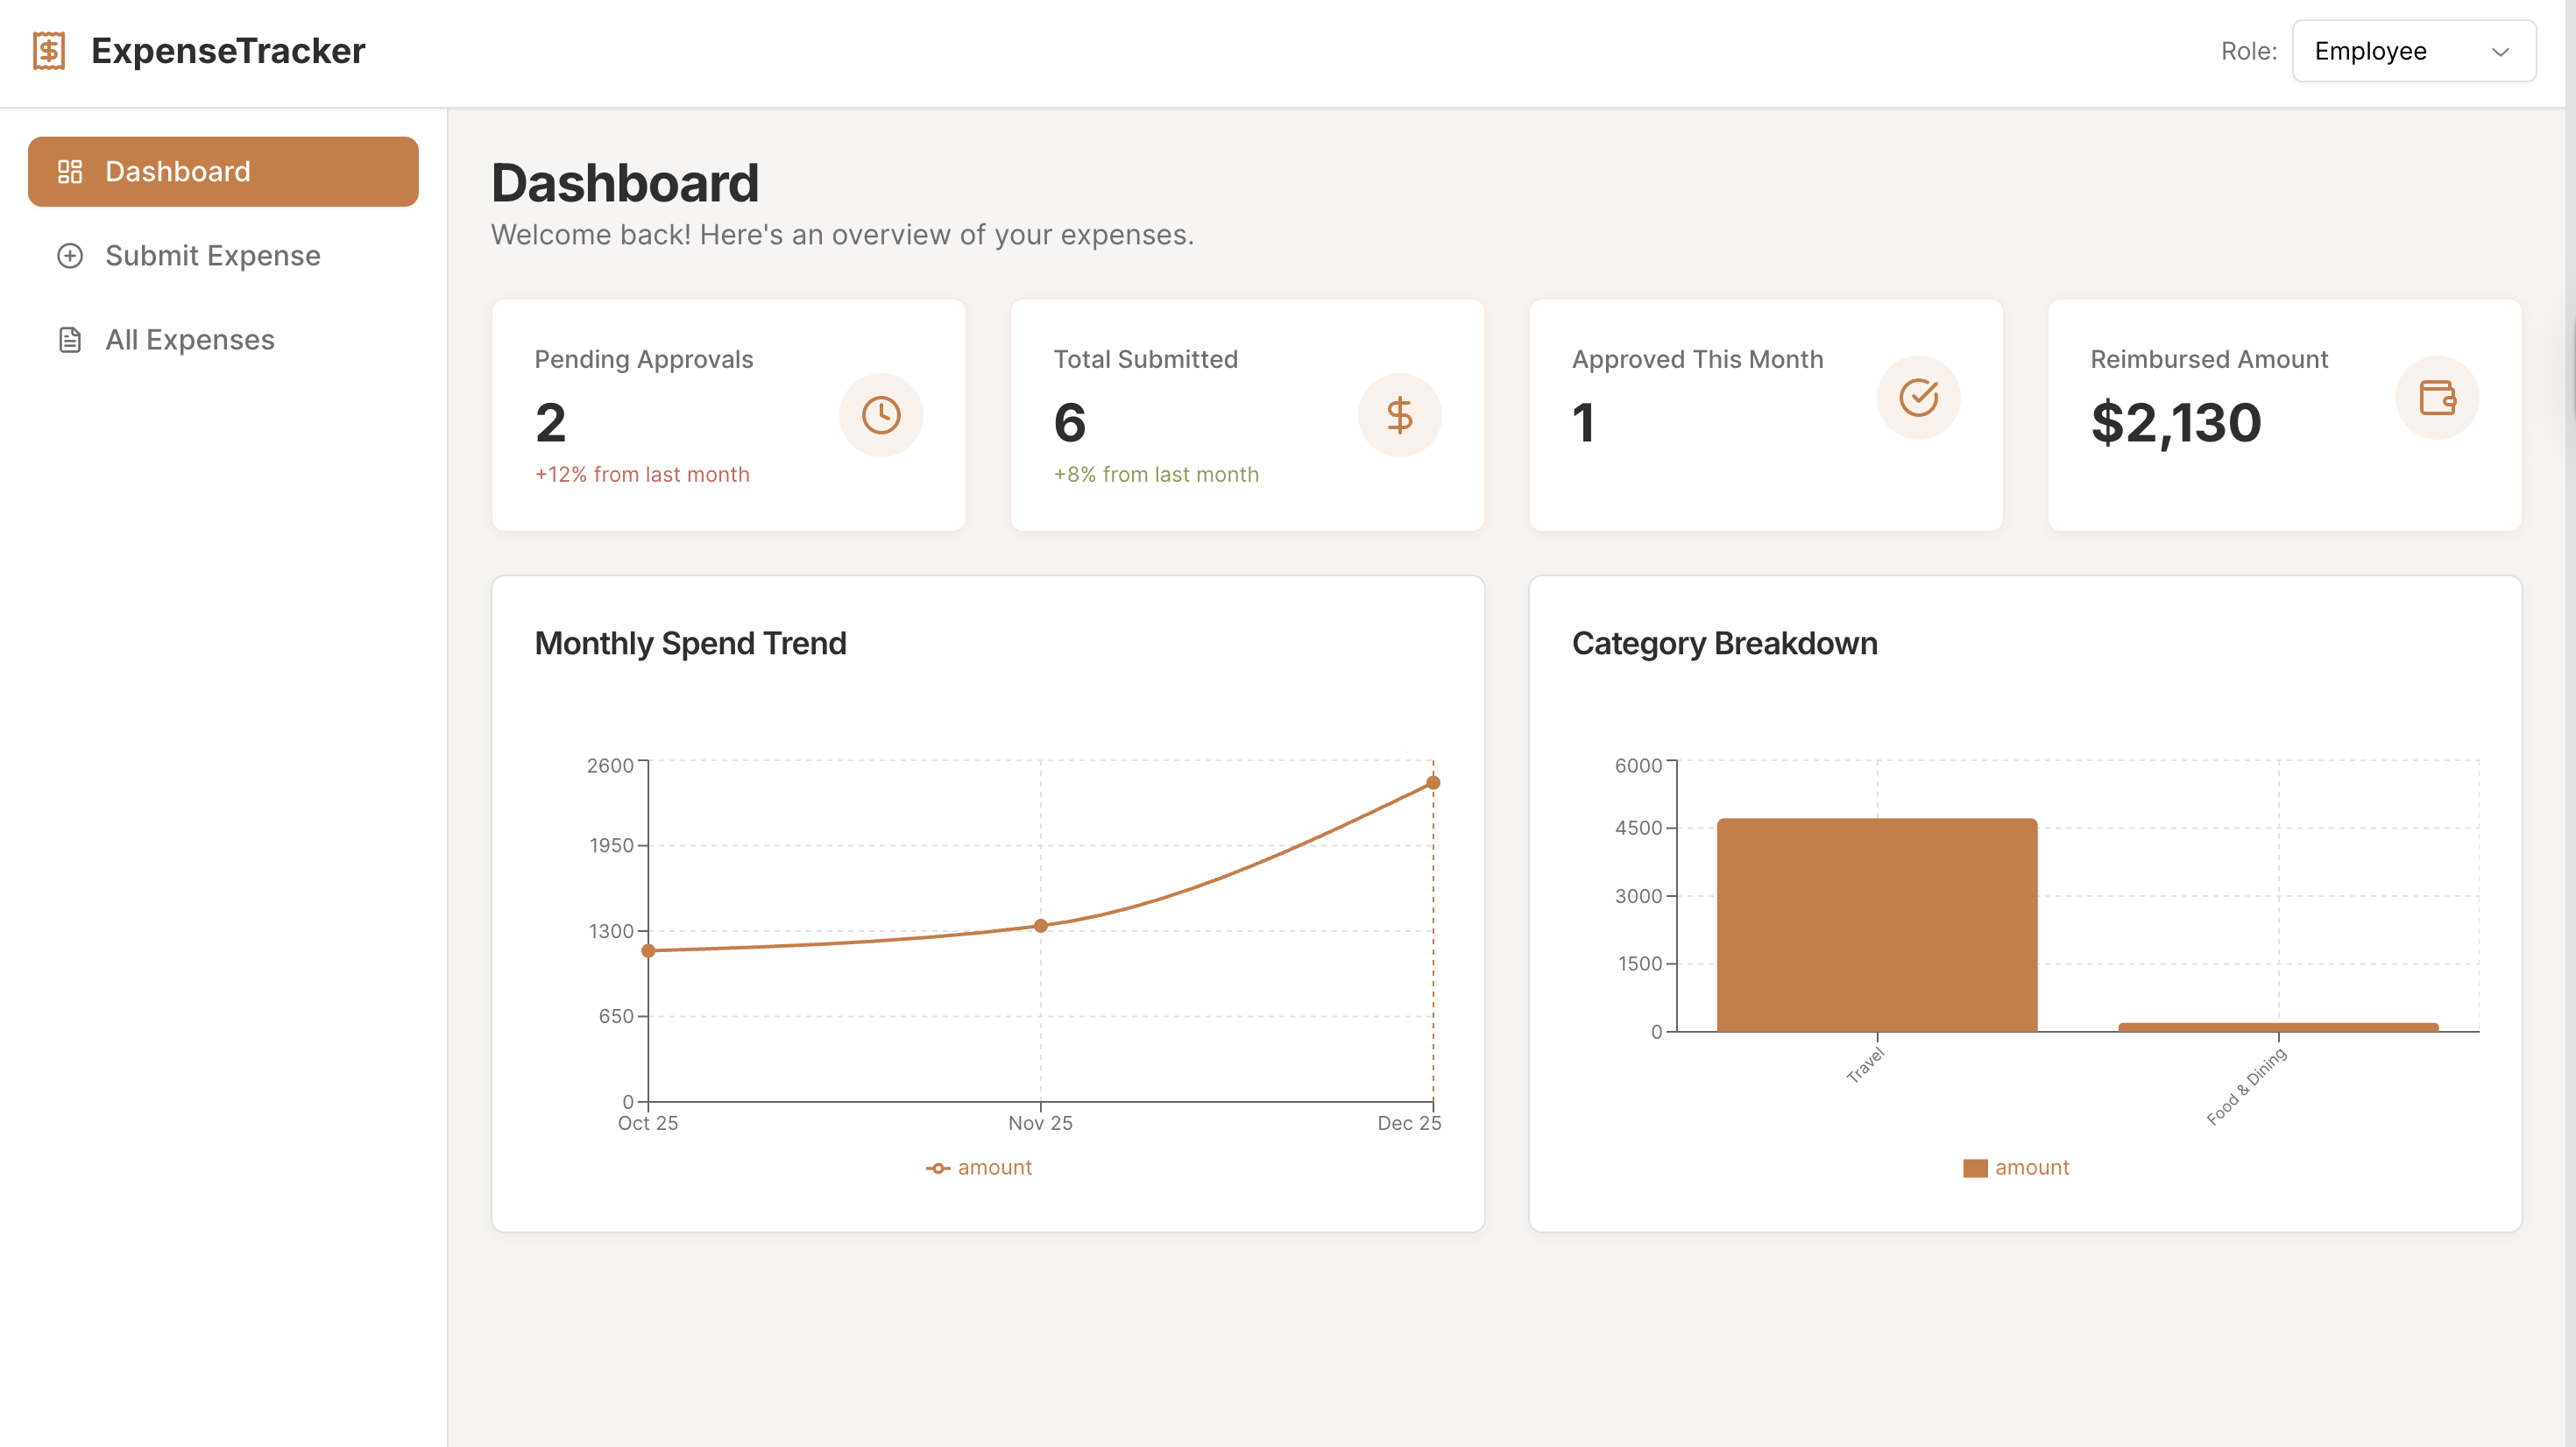
Performance Metrics & System Insights
Analyze real-time system performance with KPIs such as response times, error rates, and query efficiency. Use filters to drill into trends by date, user role, or product category.
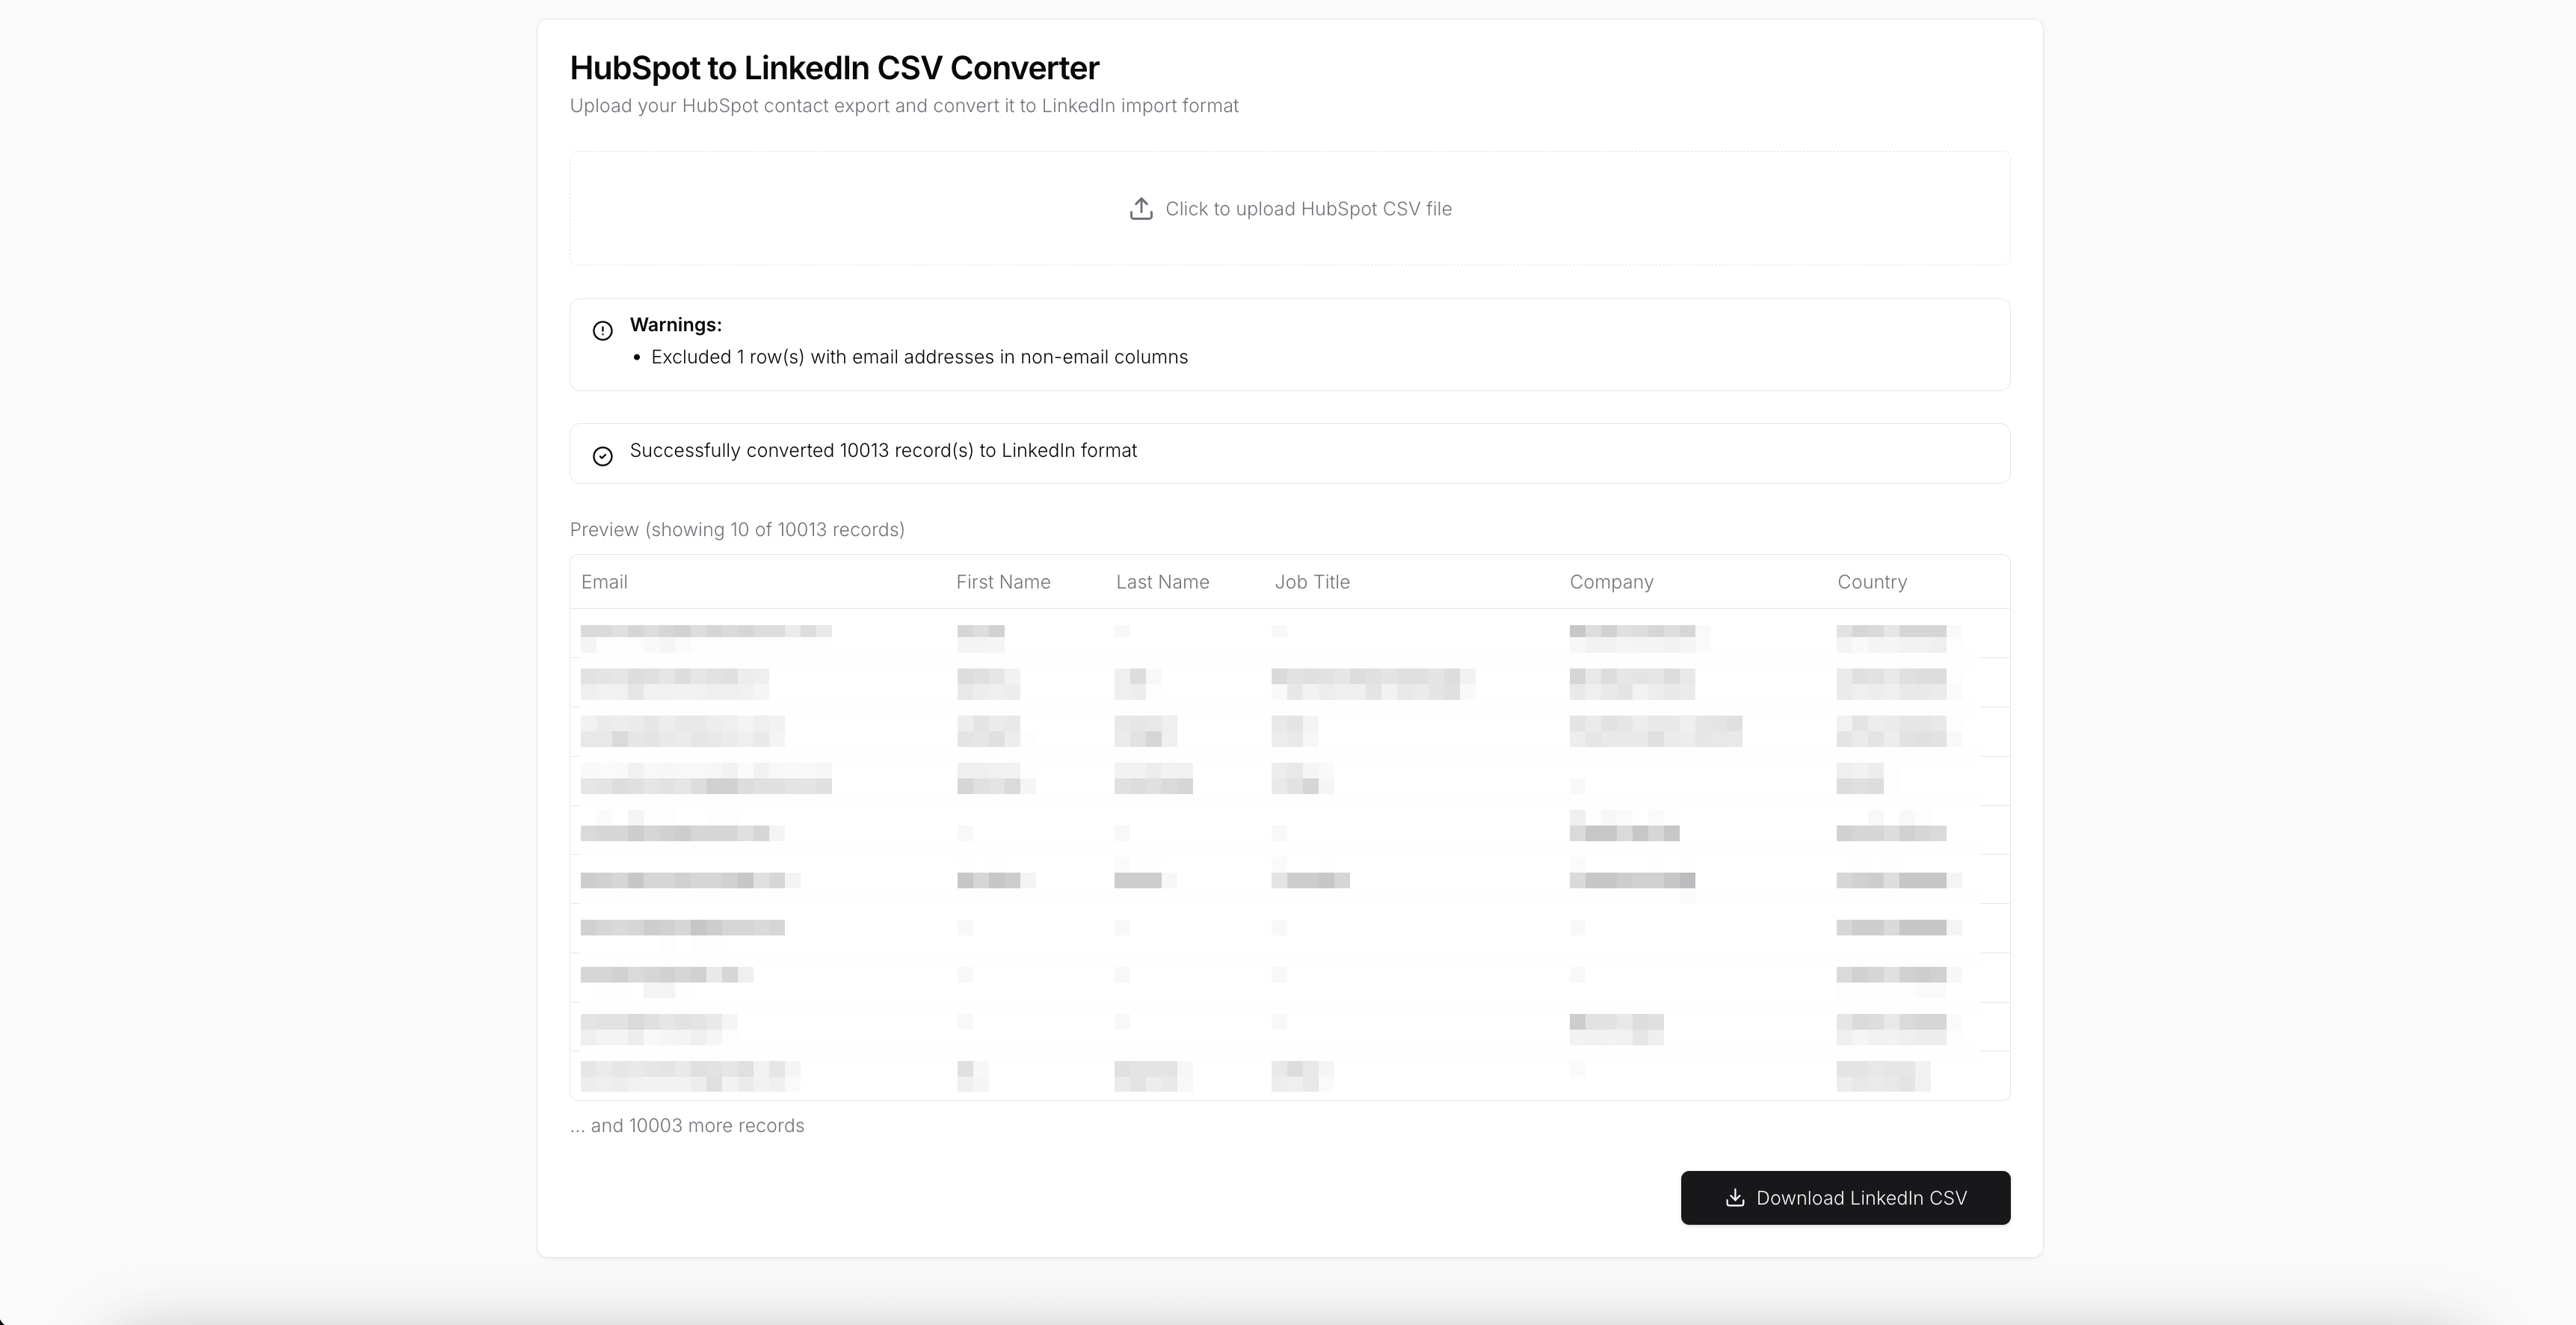
Exportable Data
Download tables as CSV for reporting, presentations, or archival purposes.
Use Cases
- Admin dashboards for Supabase developers and DBAs
- Subscription analytics and revenue monitoring platforms
- Database monitoring tools for data engineers
- Internal reporting and performance review dashboards
- Operational oversight for SaaS applications
Start Building Your Own Supabase Admin Dashboard
Use this Supabase Admin Dashboard template as a foundation to create a fully custom monitoring system. Connect live Supabase data, visualize user and subscription trends, track revenue, and provide stakeholders with actionable insights with UI Bakery’s low-code tools.
How the Supabase Dashboard works
UI Bakery enables you to transform your data into dynamic internal tools, leveraging a combination of pre-built and customized components.
- To initiate, click "Sign up".
- Establish your organization and create app "From template"
- Customize your generated application visually by intuitively dragging and dropping components and crafting queries for your resources.
- Expand the capabilities of this application by linking to your personal database, kickstarting the development of robust internal tools.
Related Supabase Dashboard templates


Related Supabase Dashboard templates

"The UI Bakery platform offers a cost-effective approach to creating applications. With UI Bakery, you can achieve your app development goals without breaking the bank."
