Stripe Dashboard

Overview
Track payments, revenue, and transaction activity with a centralized Stripe Dashboard.
This dashboard connects directly to your Stripe data and provides a clear overview of financial performance, transaction history, and order activity, helping teams monitor revenue flow and stay on top of payment operations.
Key Features
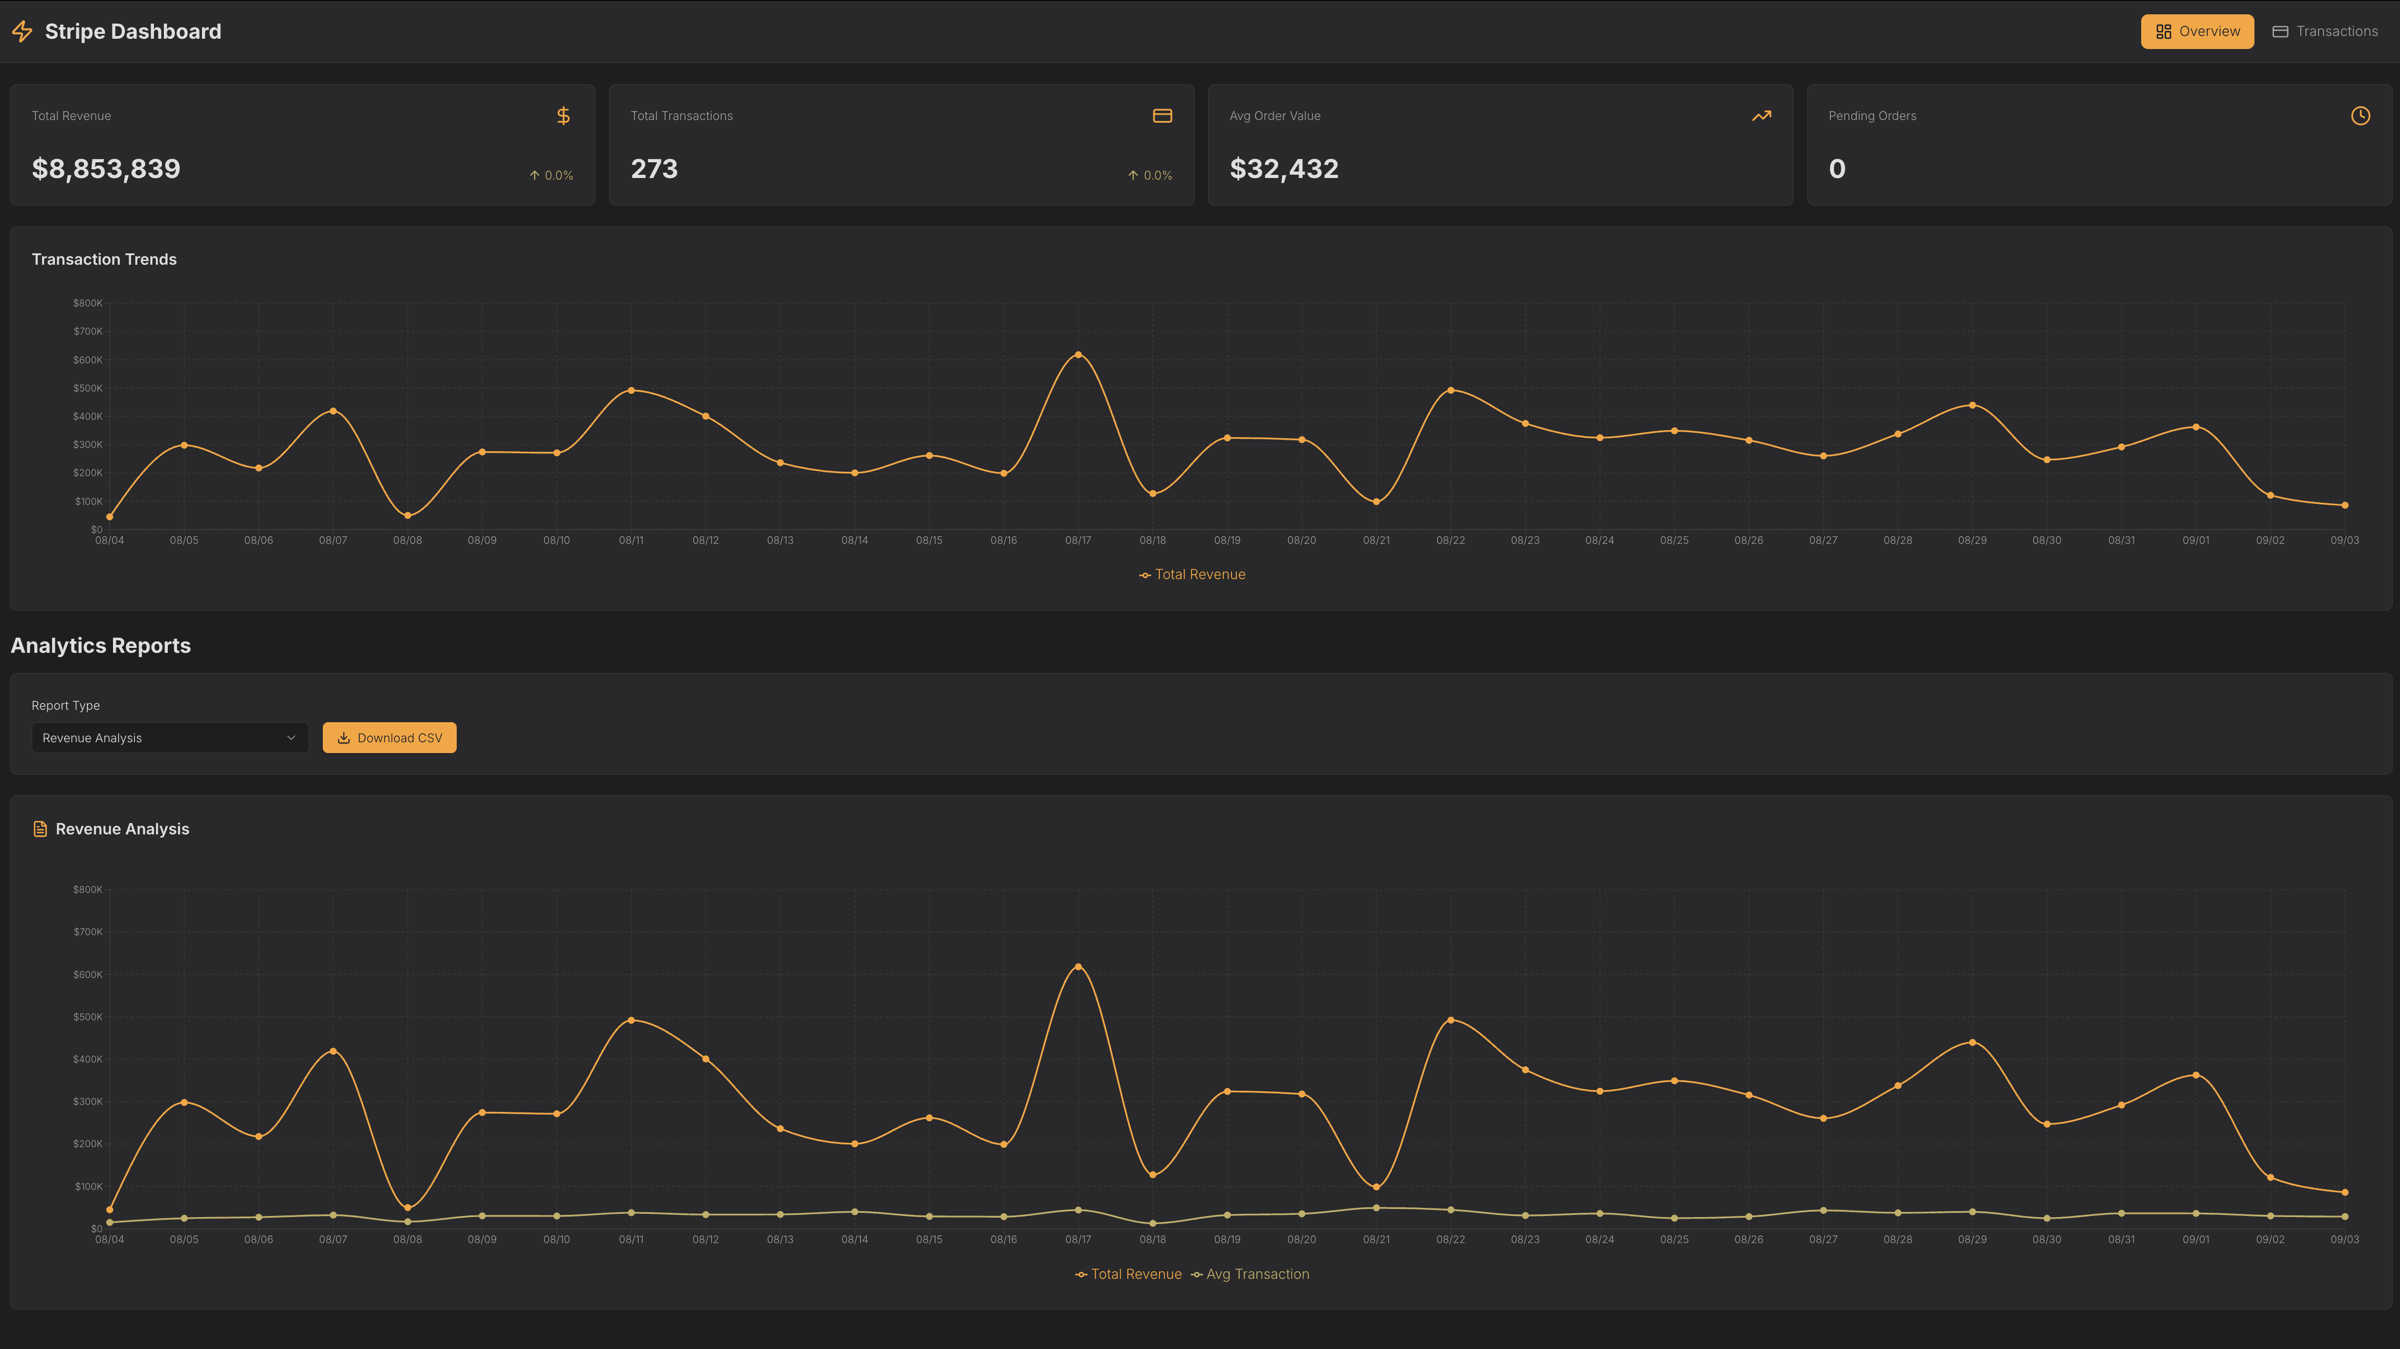
Revenue & Transaction KPIs
Monitor total revenue, total transactions, average order value, and pending orders through KPI cards that summarize overall payment performance at a glance.
Analytics Reports
Analyze revenue trends and order activity using dedicated analytics reports. Switch between revenue analysis and order analytics charts and export results as CSV for reporting and deeper analysis.
Transaction Monitoring & Details
Review all transactions in a searchable, sortable table showing payment ID, transaction date, amount, and check number. Open any transaction to view full details in a side panel for complete visibility.
Use Cases
- Payment monitoring dashboards for finance teams
- Revenue tracking tools for subscription or e-commerce businesses
- Transaction history and audit dashboards
- Internal finance and accounting reporting tools
- Operational dashboards for payment reconciliation
Start Building Your Own Stripe Dashboard
Use this Stripe Dashboard template to build a custom payment monitoring solution. Connect live Stripe data, track revenue and transactions, analyze order activity, and generate financial insights with UI Bakery’s platform.
How the Stripe Dashboard template works
UI Bakery enables you to transform your data into dynamic internal tools, leveraging a combination of pre-built and customized components.
- To initiate, click "Sign up".
- Establish your organization and create app "From template"
- Customize your generated application visually by intuitively dragging and dropping components and crafting queries for your resources.
- Expand the capabilities of this application by linking to your personal database, kickstarting the development of robust internal tools.
Related Stripe Dashboard templates


Related Stripe Dashboard templates

"The UI Bakery platform offers a cost-effective approach to creating applications. With UI Bakery, you can achieve your app development goals without breaking the bank."
