Investor Update

Overview
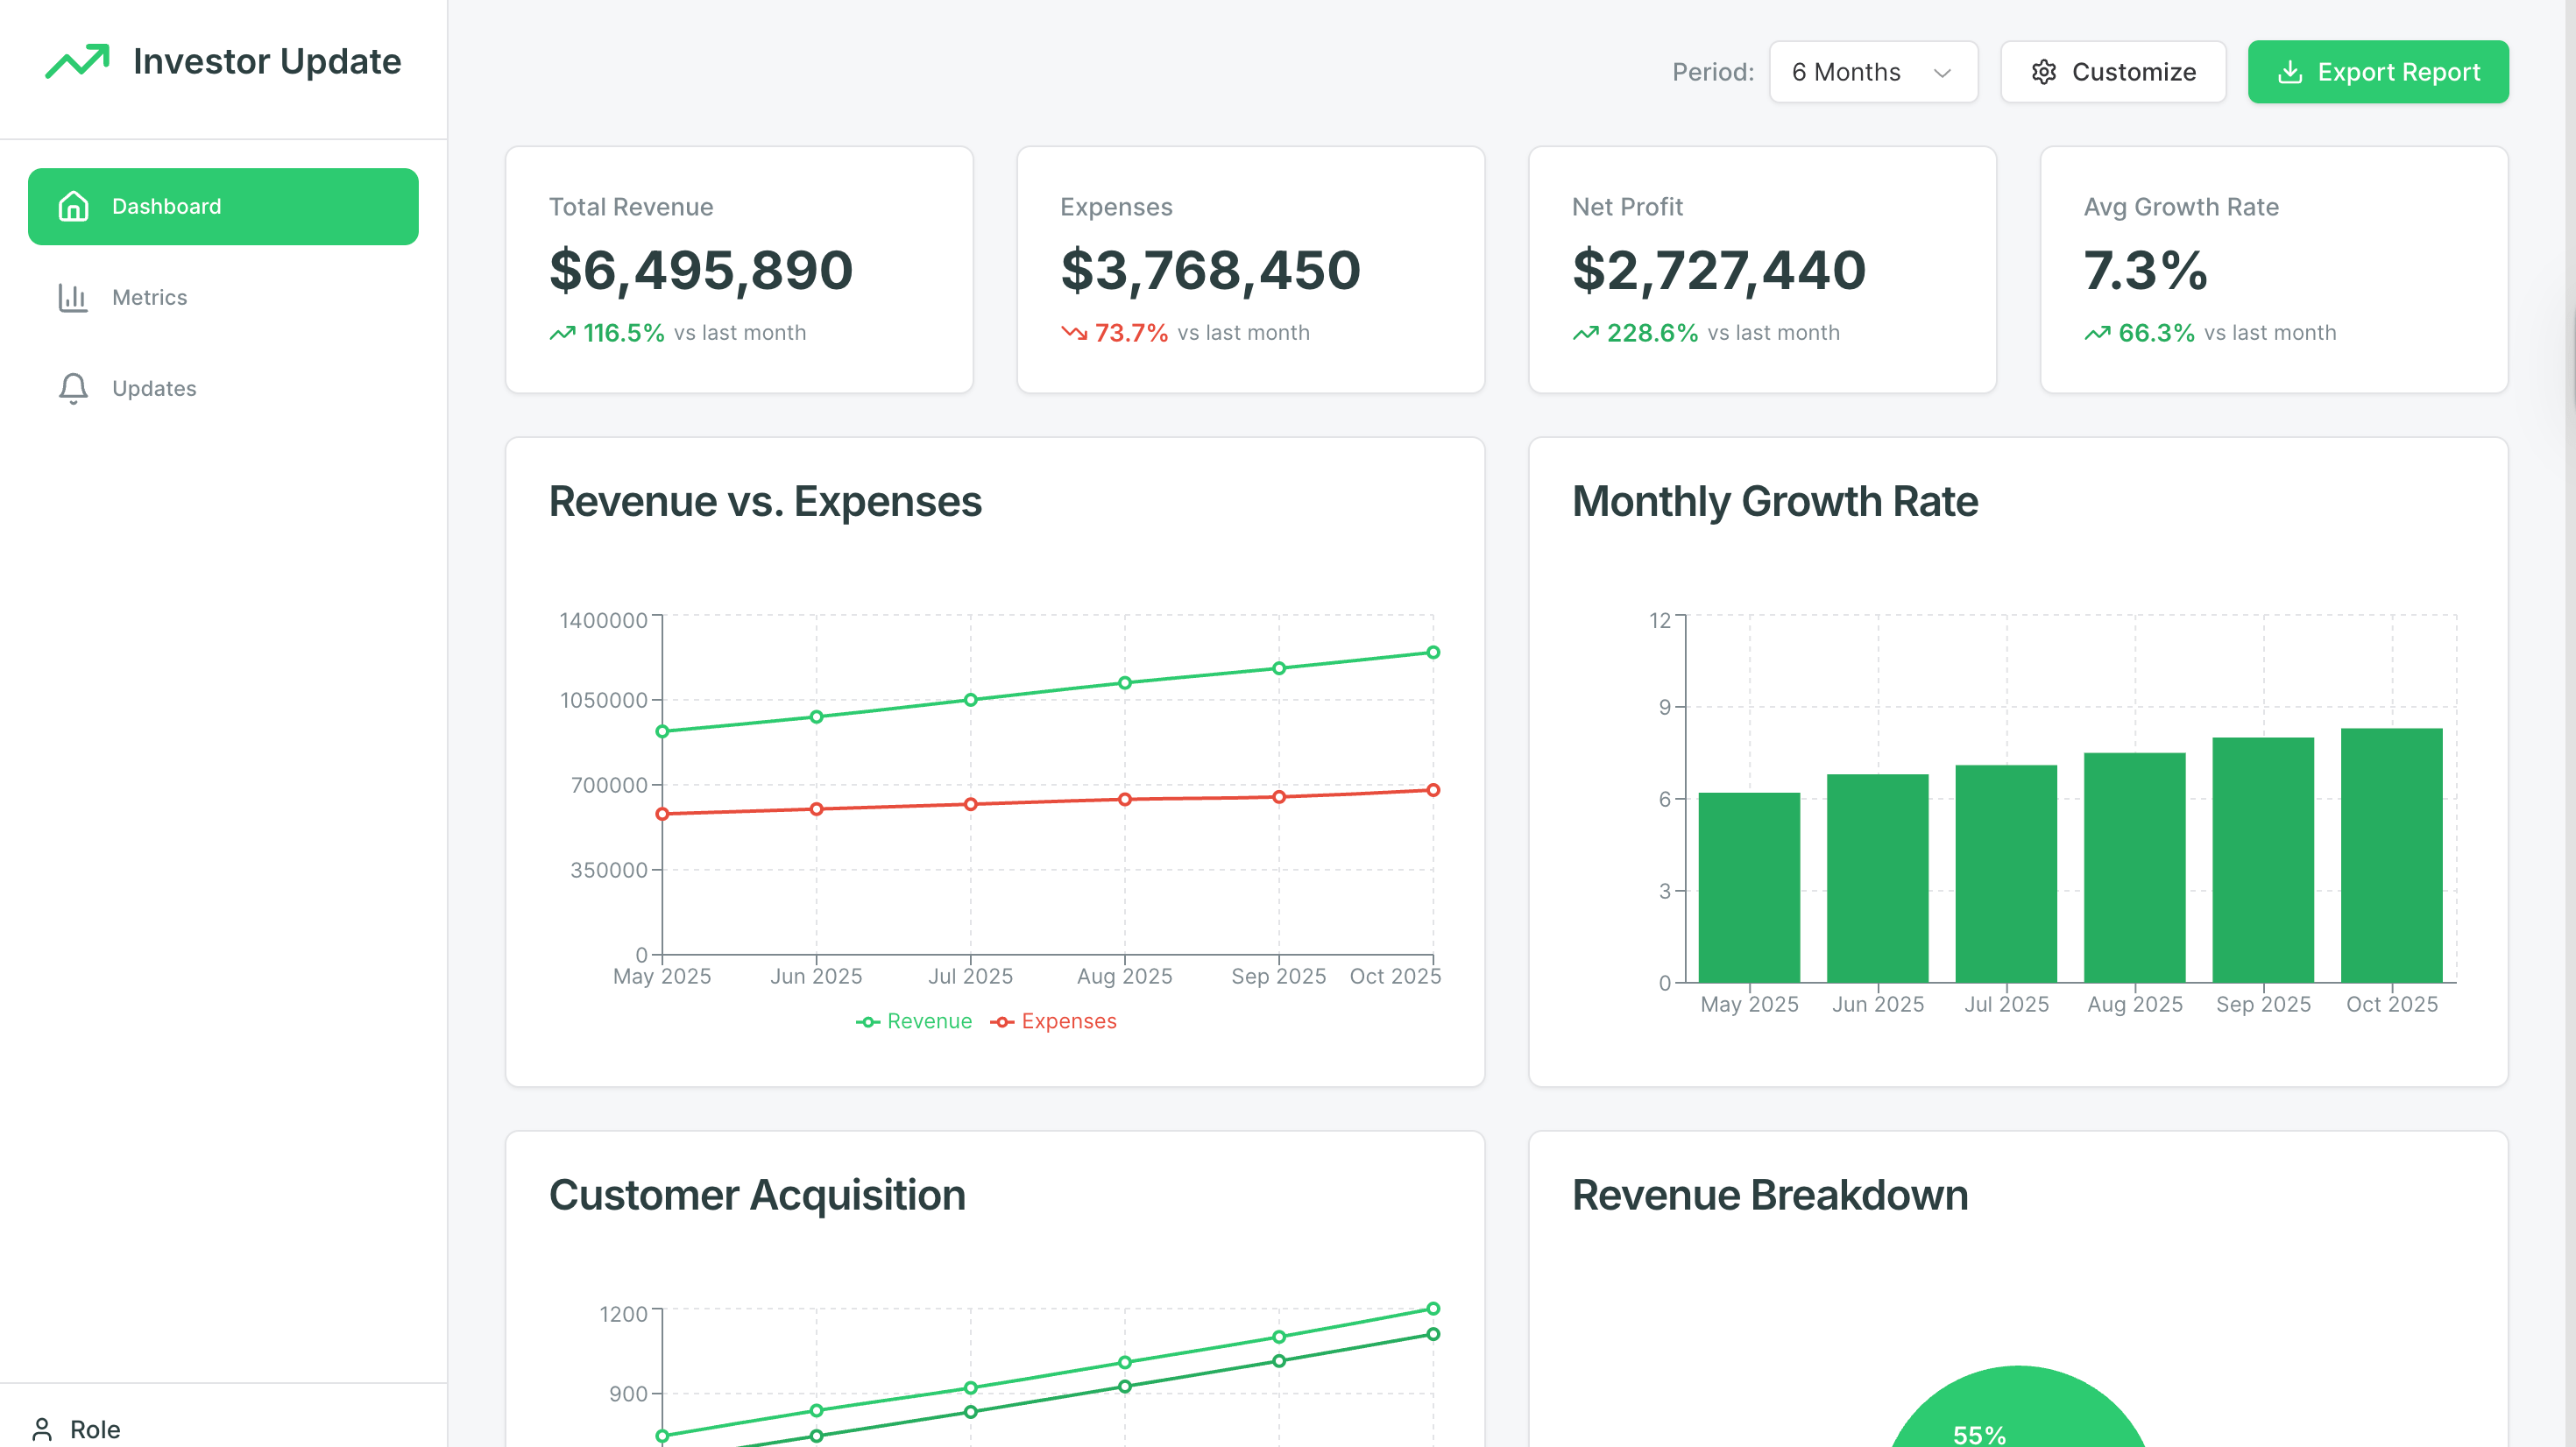
Keep investors informed and aligned with your company’s financial performance and growth metrics in one unified dashboard.
The Investor Update Dashboard offers a clean, investor-focused experience that bridges data transparency and actionable insights - enabling both founders and investors to track financial health, company progress, and key milestones in real time.
Key Features
Dual Role-Based Access for Admins and Investors
Support two distinct user roles with tailored permissions - admins can manage data, post company updates, and customize dashboards, while investors access curated financial summaries and performance insights. This structure ensures secure and context-relevant visibility.
Comprehensive KPI Tracking and Financial Analytics
Monitor core financial metrics, including revenue, expenses, profit, growth rate, ROI, runway, MRR, CAC, LTV, and churn. Visualize financial performance through trend charts and KPI cards with color-coded highlights that reveal growth and risk patterns instantly.
Dynamic Metrics Management and Drill-Down Analysis
Explore, filter, and sort key company metrics by time period, category, or department. Interactive charts enable deeper data analysis and performance tracking over time, giving both teams and investors the context behind every metric.
Company Updates and Communication Feed
Centralize your investor communications with a real-time updates feed for company announcements, milestone reports, and operational highlights. Admins can publish new updates directly, ensuring stakeholders always have the latest company news.
Data Export and Report Generation
Easily export dashboards and metrics to PDF or Excel for investor briefings and board meetings. The export-ready layout and responsive design make sharing insights seamless across devices and formats.
Use Cases
- Investor reporting and stakeholder communication
- Financial transparency for startups and scale-ups
- Real-time performance tracking for VC or angel portfolios
- Monthly or quarterly investor update automation
- Internal leadership dashboards for tracking growth metrics
Start Building Your Own Investor Update Dashboard
Use this Investor Update Dashboard template to build your company’s investor relations hub - connect live financial data, automate updates, and give investors a clear, data-driven view of your business growth, all in one secure and professional interface.
How Investor update templates works?
UI Bakery enables you to transform your data into dynamic internal tools, leveraging a combination of pre-built and customized components.
- To initiate, click "Sign up".
- Establish your organization and create app "From template"
- Customize your generated application visually by intuitively dragging and dropping components and crafting queries for your resources.
- Expand the capabilities of this application by linking to your personal database, kickstarting the development of robust internal tools.
Related Investor update templates


Related Investor update templates
Frequently Asked Questions
What is the purpose of the Investor Update template?
The Investor Update template is designed for businesses and startups to create professional and informative updates for investors. It provides a structured format to communicate important company milestones, financial performance, market insights, and future plans to investors and stakeholders.
Can businesses customize the content of the Investor Update, including financial data and achievements?
Yes, businesses can customize the content of the Investor Update. The template offers flexibility to include financial data, achievements, key performance indicators, and other relevant information. Businesses can tailor the update to showcase specific milestones and accomplishments.
Does the template provide visualizations and charts to represent financial and performance data?
Yes, the template provides visualizations and charts. Businesses can incorporate charts, graphs, and visual representations of financial and performance data to present information in a visually appealing and comprehensible manner, making it easier for investors to grasp key insights.
Is there a feature for attaching documents or additional reports to the Investor Update?
Yes, the template allows attachments. Businesses can attach documents, reports, presentations, or supplementary materials to the Investor Update update. This feature enables businesses to provide in-depth information and detailed reports alongside the main update for investors' reference.
Can businesses schedule and automate the delivery of Investor Update updates at regular intervals?
The template itself does not include automated scheduling features. However, businesses can copy the template contents to other tools or platforms that offer scheduling capabilities to automate the delivery of Investor Update at regular intervals.

"The UI Bakery platform offers a cost-effective approach to creating applications. With UI Bakery, you can achieve your app development goals without breaking the bank."
