Google Sheets Dashboard

Overview
Visualize and analyze your financial and market data with a clean, interactive interface powered by your connected Google Sheets data source.
The Google Sheets Dashboard centralizes key metrics, market trends, and business performance in one accessible platform, enabling teams to make informed decisions with clarity and efficiency.
Key Features
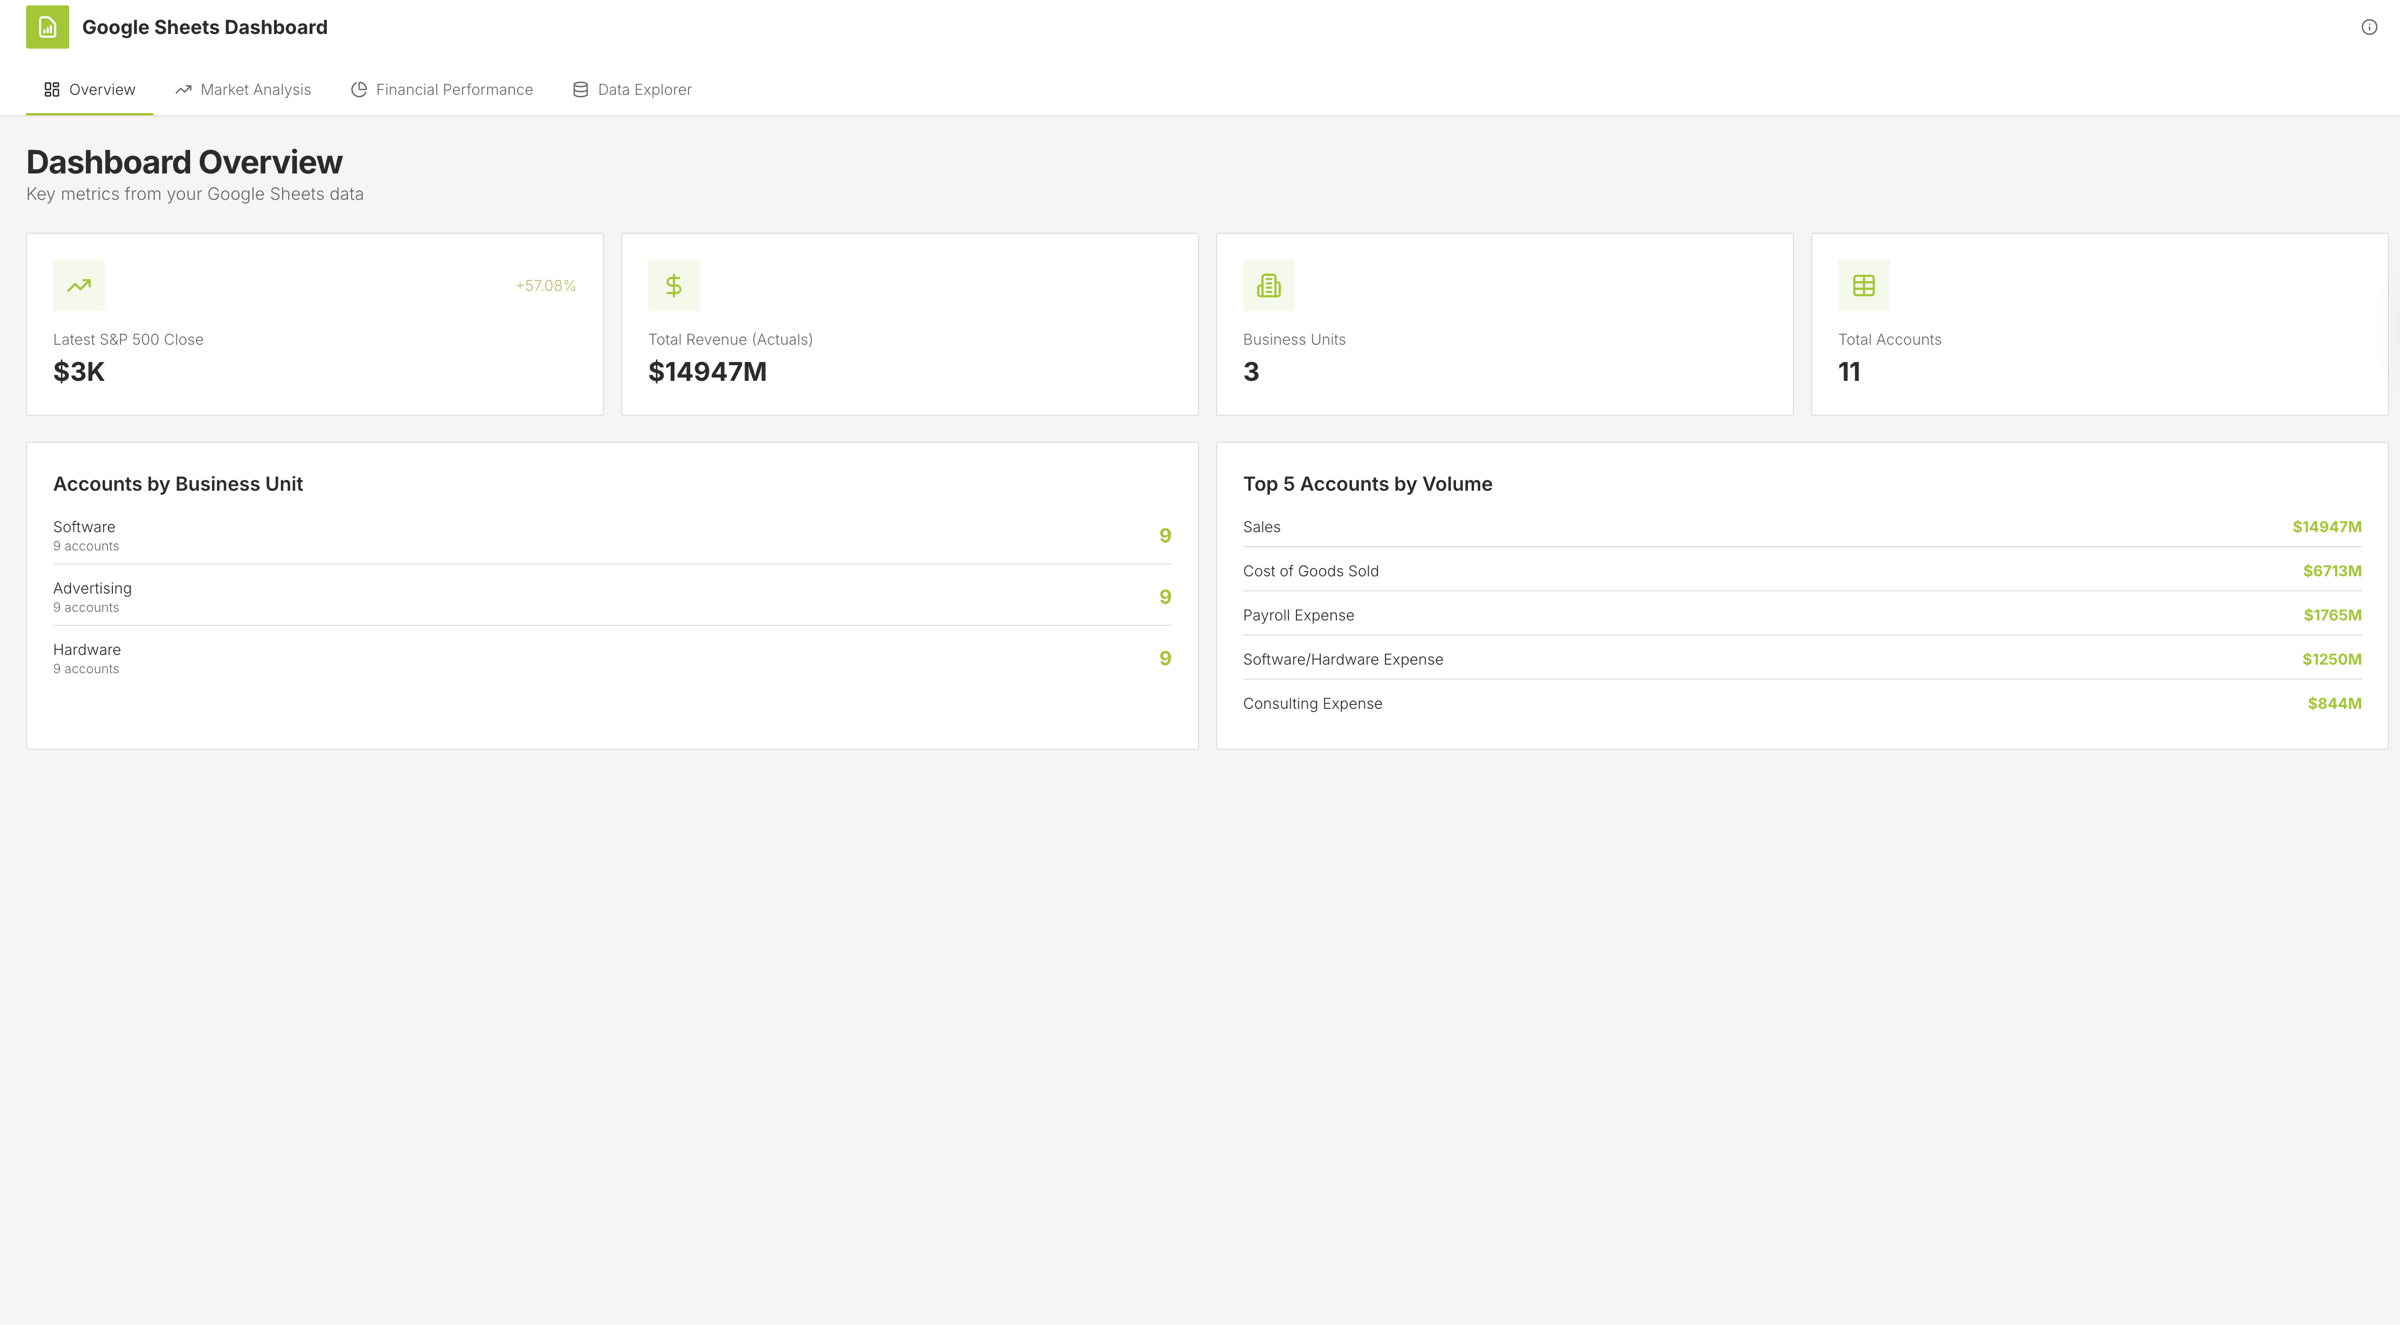
Comprehensive KPI Tracking & Market Insights
Monitor critical metrics such as S&P 500 close, total revenue, business units, and account performance with interactive KPI cards and overview panels.
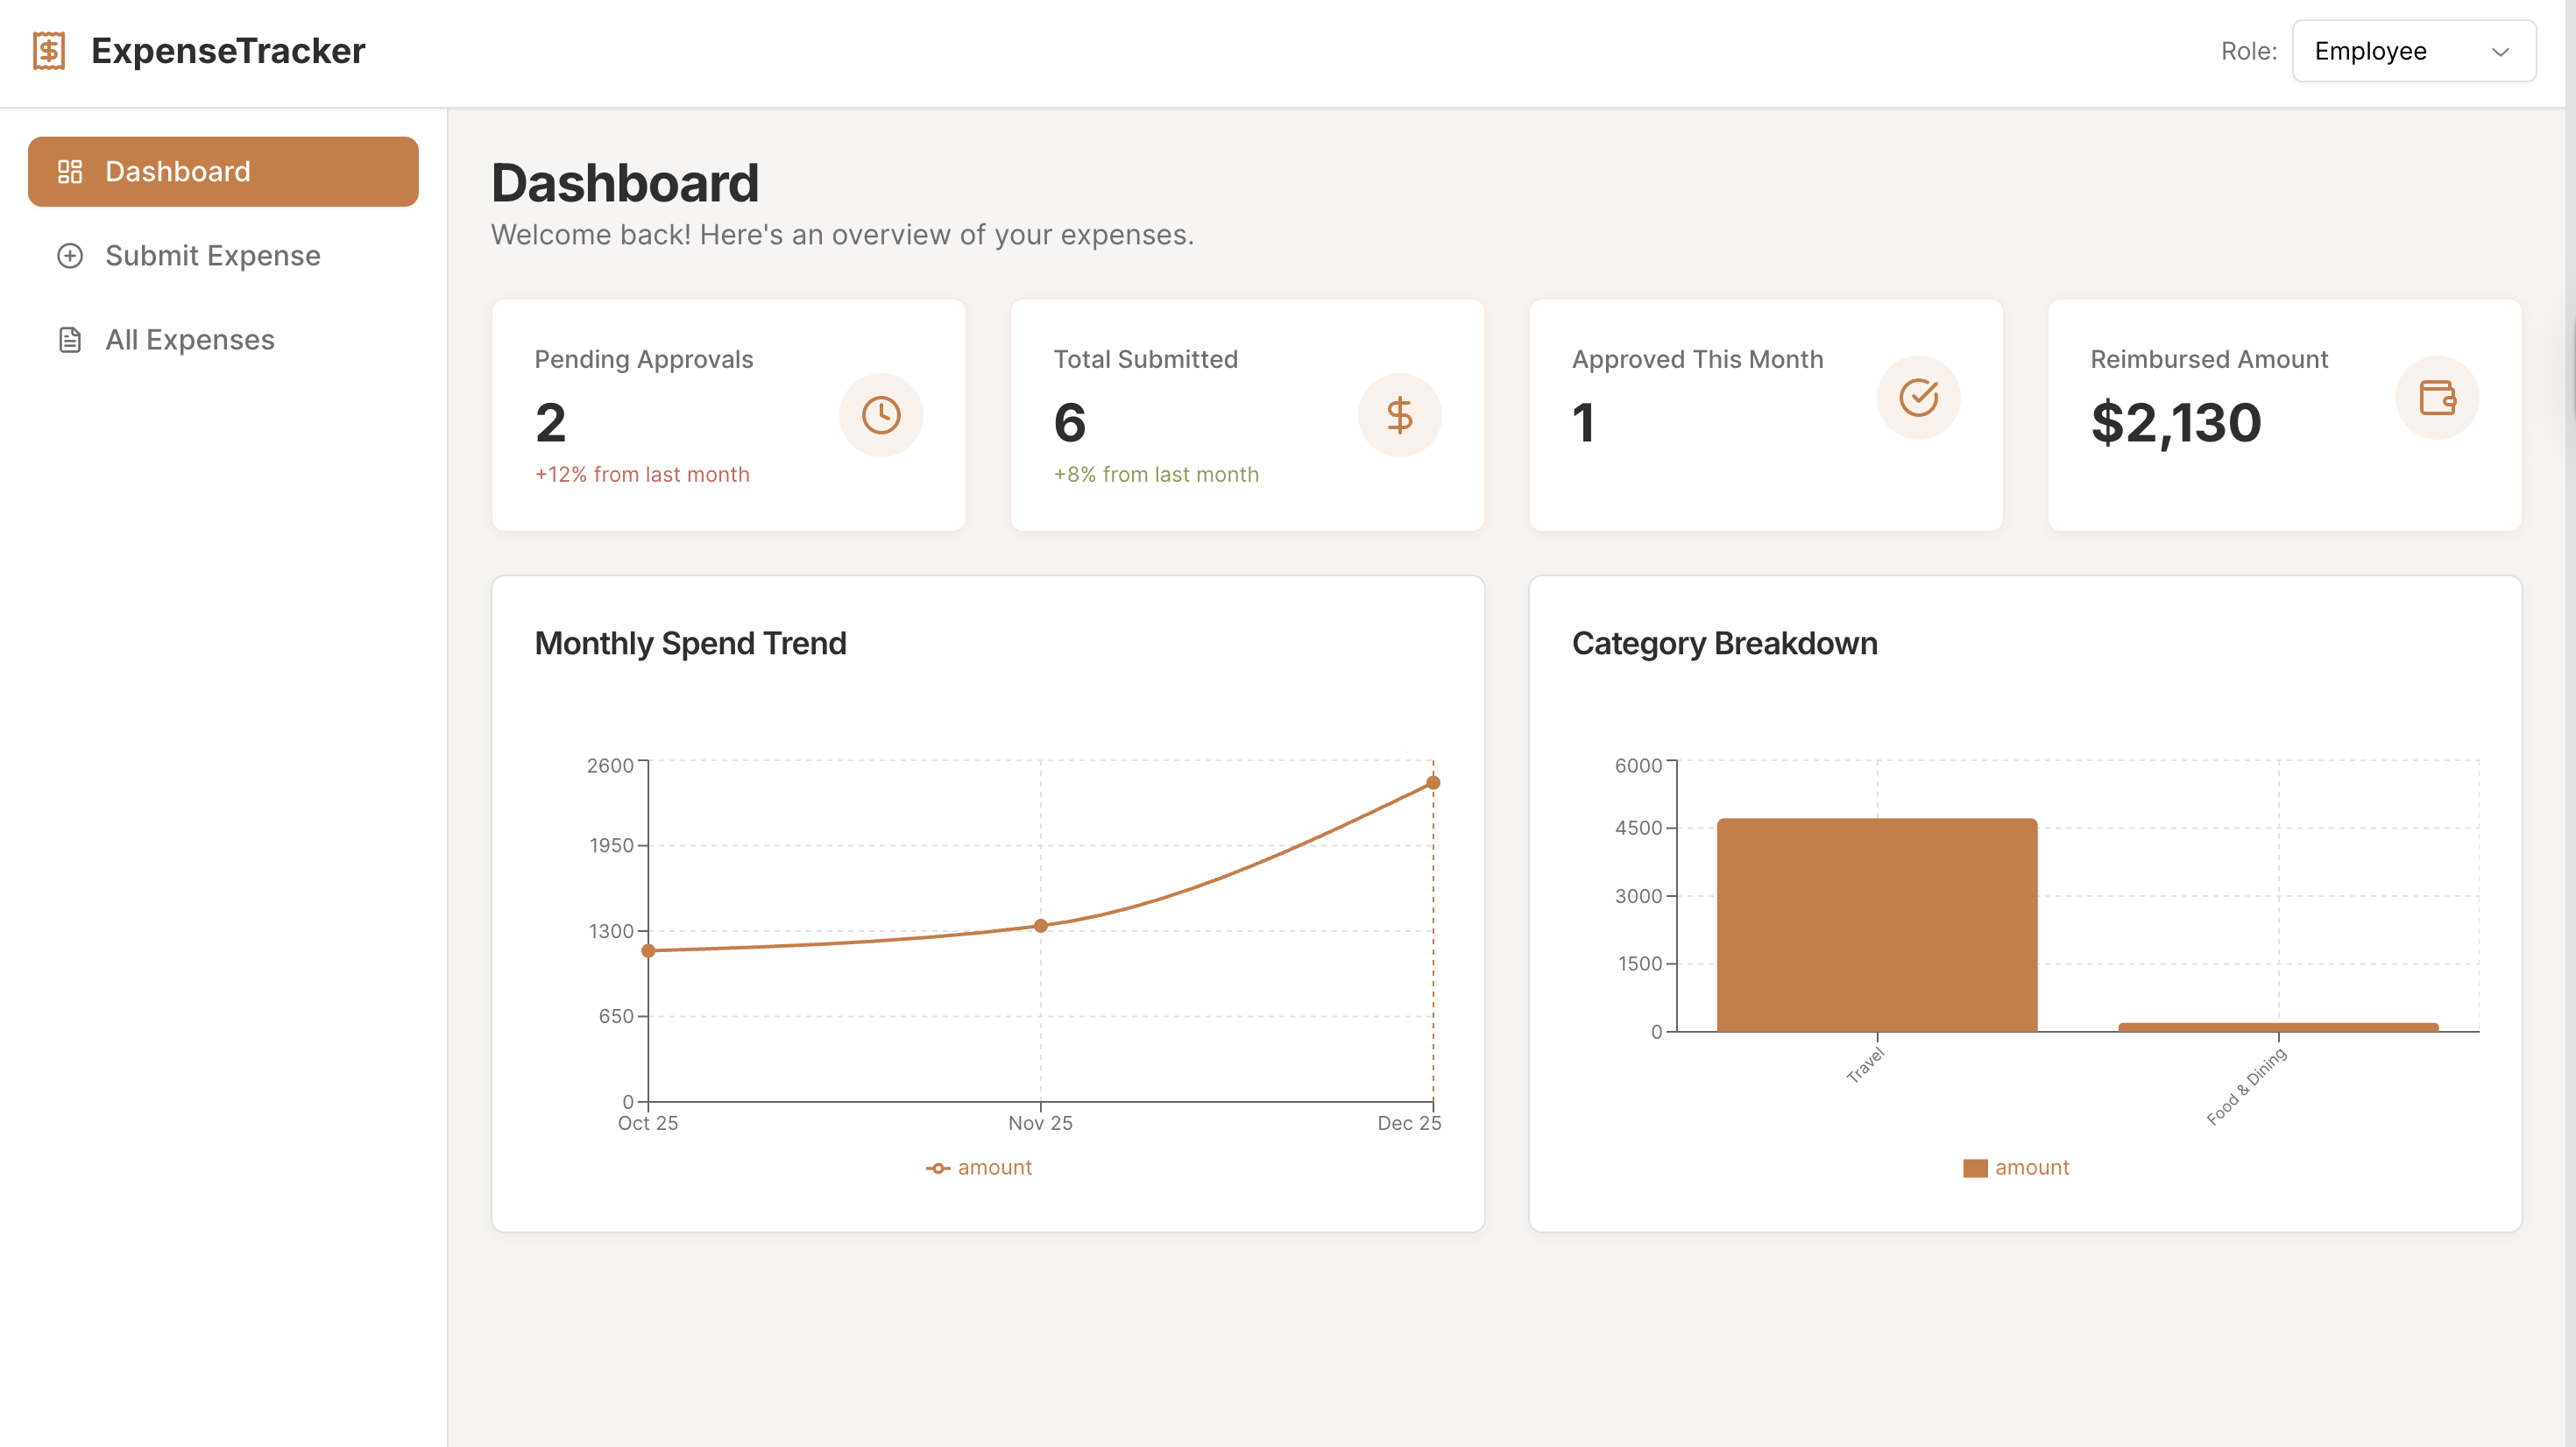
Financial Performance Analysis & Reporting
Filter and analyze data by actuals, budget, or forecast across business units and accounts. Visualize trends with dynamic charts and tables to uncover insights on revenue, expenses, and operational performance.
Interactive Data Explorer & Tables
Access detailed tables for S&P 500 data and financial records, including account-level expenses, commissions, and payroll. Sort, filter, and explore data across months, years, and scenarios to support strategic decisions.
Use Cases
- Financial analysis dashboards for investment teams
- Executive reporting for business units and accounts
- Market trend monitoring for analysts and portfolio managers
- Internal tools for comparing actuals, budgets, and forecasts
Start Building Your Own Google Sheets Dashboard
Use this template as a foundation to connect live Google Sheets data, track KPIs, explore financial and market metrics, and generate actionable insights for your team. Customize charts, tables, and filters to align with your business objectives using UI Bakery’s platform.
How Google Sheets Dashboard template works
UI Bakery enables you to transform your data into dynamic internal tools, leveraging a combination of pre-built and customized components.
- To initiate, click "Sign up".
- Establish your organization and create app "From template"
- Customize your generated application visually by intuitively dragging and dropping components and crafting queries for your resources.
- Expand the capabilities of this application by linking to your personal database, kickstarting the development of robust internal tools.
Related Google Sheets Dashboard templates


Related Google Sheets Dashboard templates

"The UI Bakery platform offers a cost-effective approach to creating applications. With UI Bakery, you can achieve your app development goals without breaking the bank."
