Data Analytics Dashboard

Overview
Monitor your business performance from a single, interactive platform.
The Data Analytics Dashboard centralizes revenue, sales, marketing, and operational metrics into one intuitive interface, helping teams track trends, optimize performance, and make data-driven decisions in real time.
Key Features
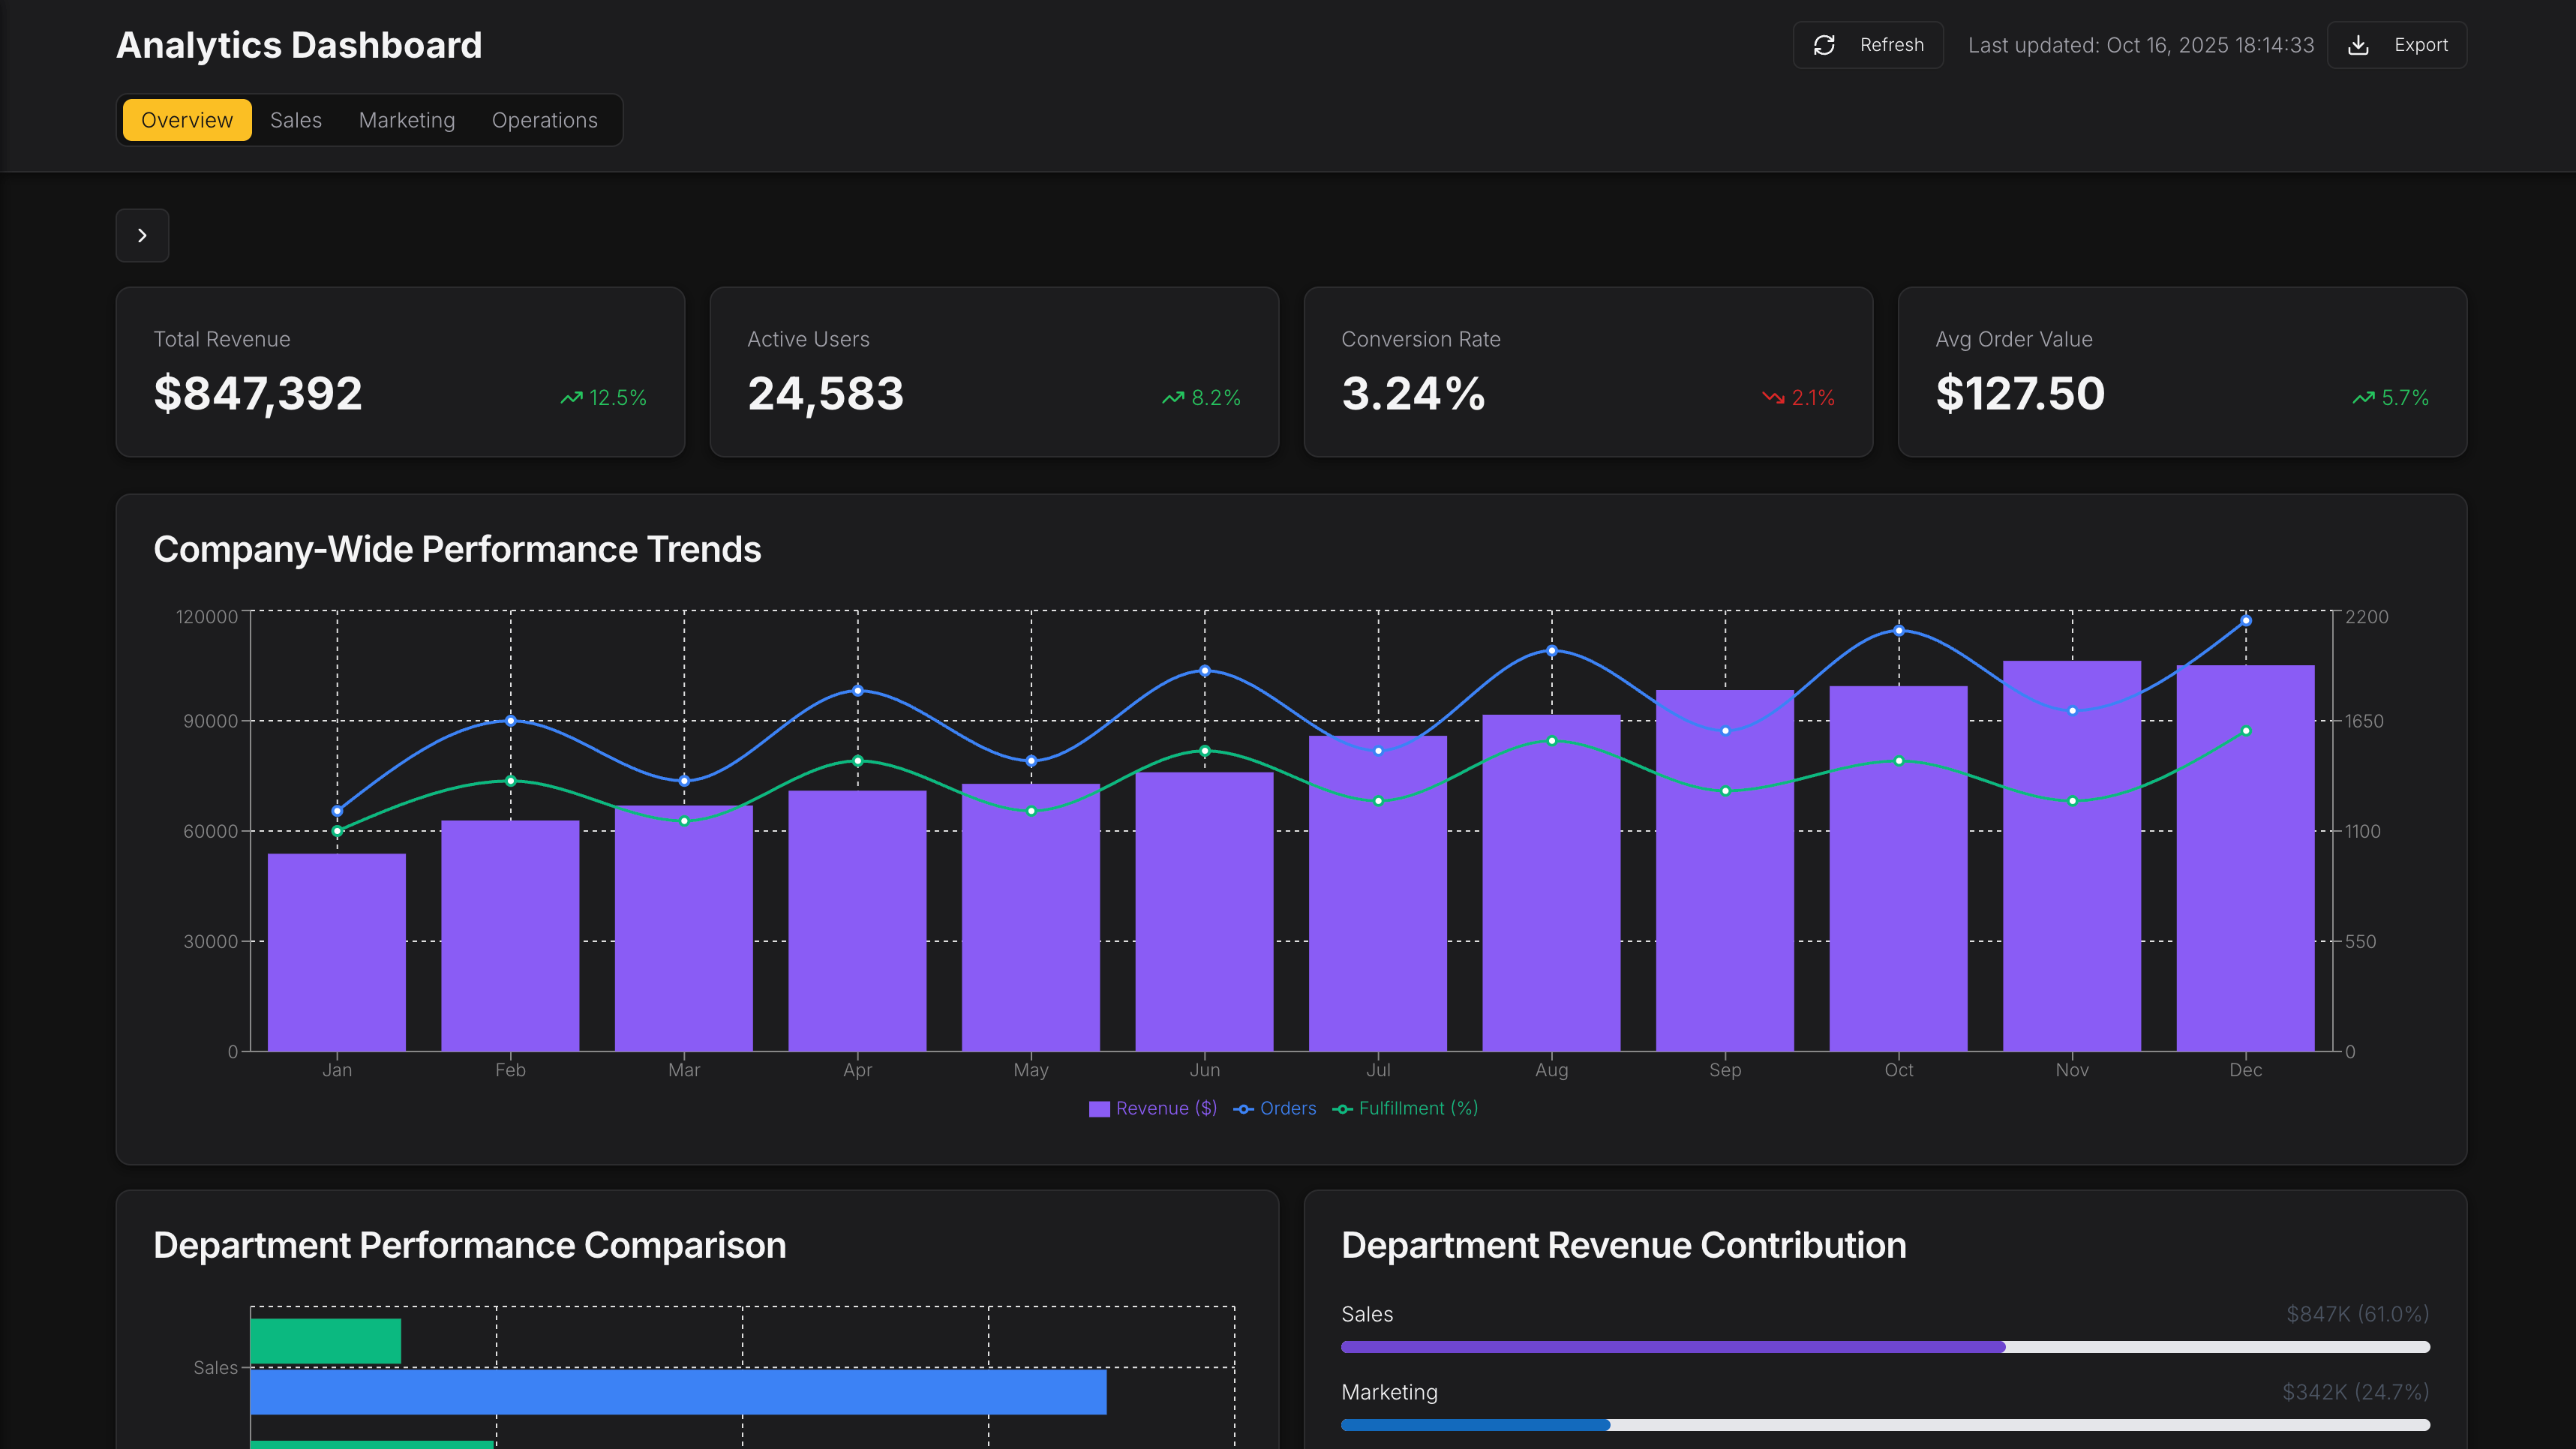
Comprehensive KPI Monitoring
Track key business metrics such as total revenue, active users, conversion rates, average order value, and operational efficiency. Interactive KPI cards and summary widgets provide an at-a-glance view of performance, enabling quick insights into both company-wide and department-level outcomes.
Interactive Data Visualization
Explore trends and performance with customizable charts and graphs. Visualize sales trends, marketing ROI, operational efficiency, and cross-department metrics using line charts, bar graphs, and comparative dashboards, providing a clear picture of organizational performance.
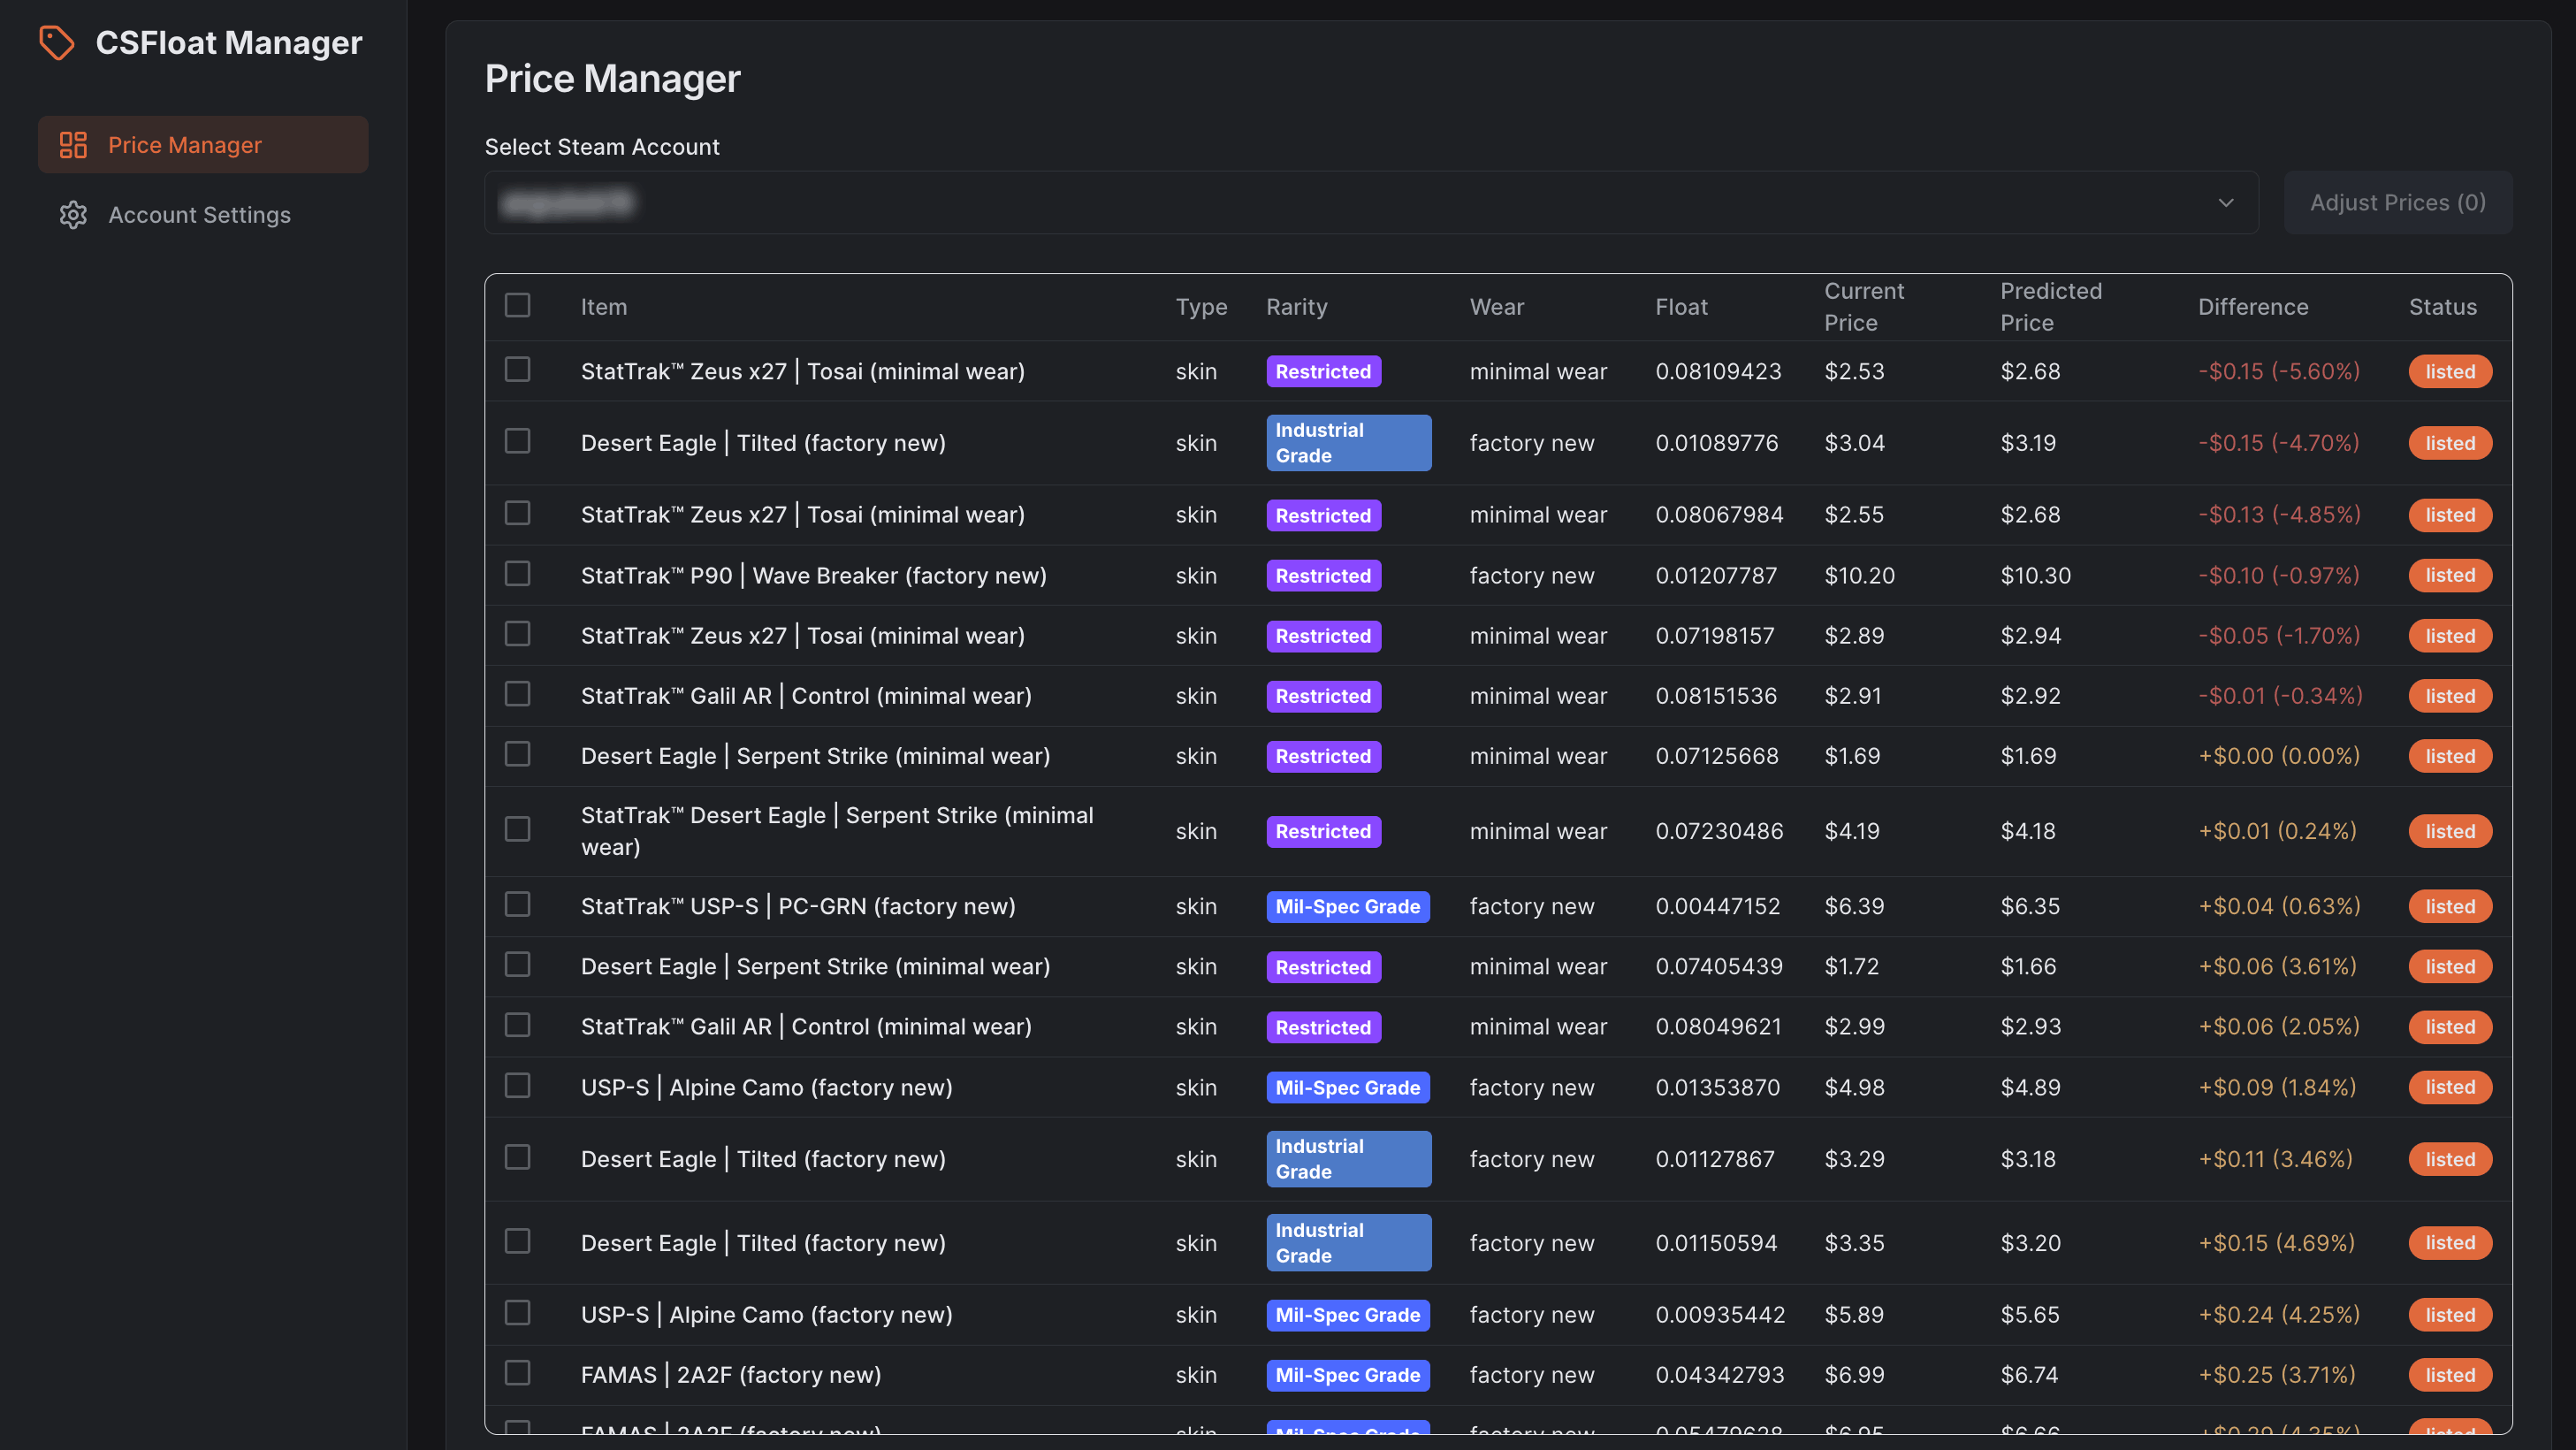
Advanced Filtering & Drill-Down
Use the expandable sidebar to filter data by date range, category, region, or status. Drill down into specific departments or metrics to understand underlying patterns, anomalies, and performance drivers across the organization.
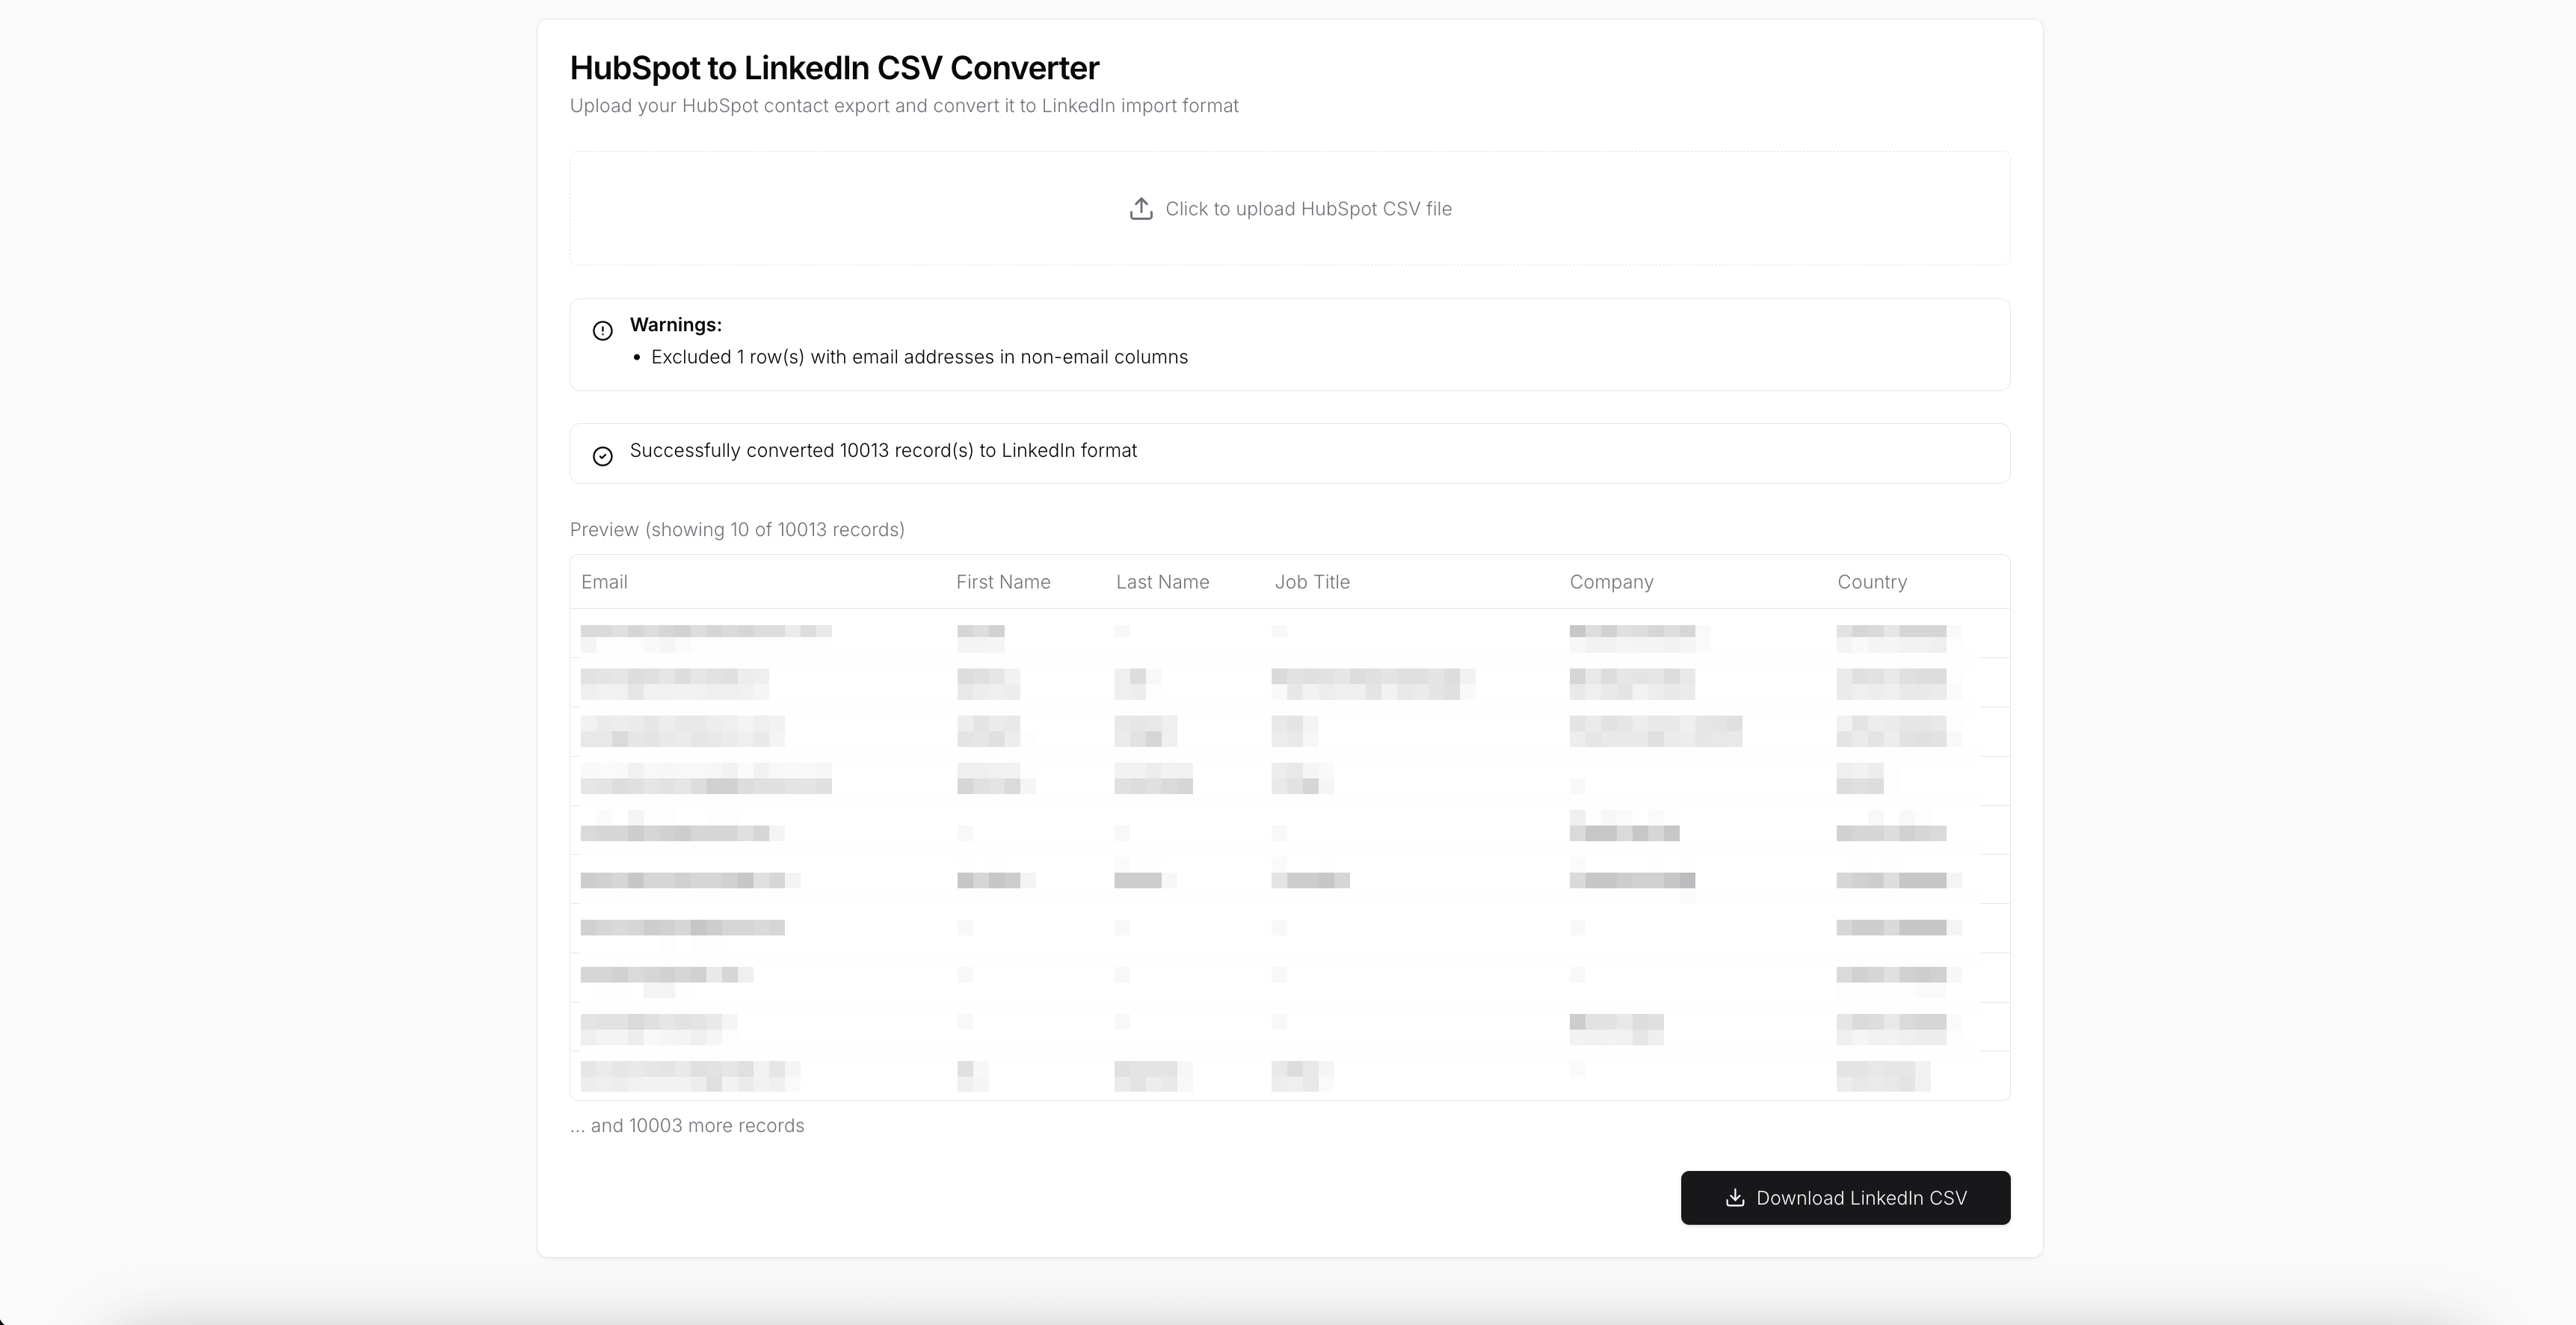
Real-Time Updates & Export
Refresh data in real time across all modules to ensure the most up-to-date insights. Export dashboards, reports, and metrics in CSV or PDF formats for team sharing, board meetings, or detailed analyses.
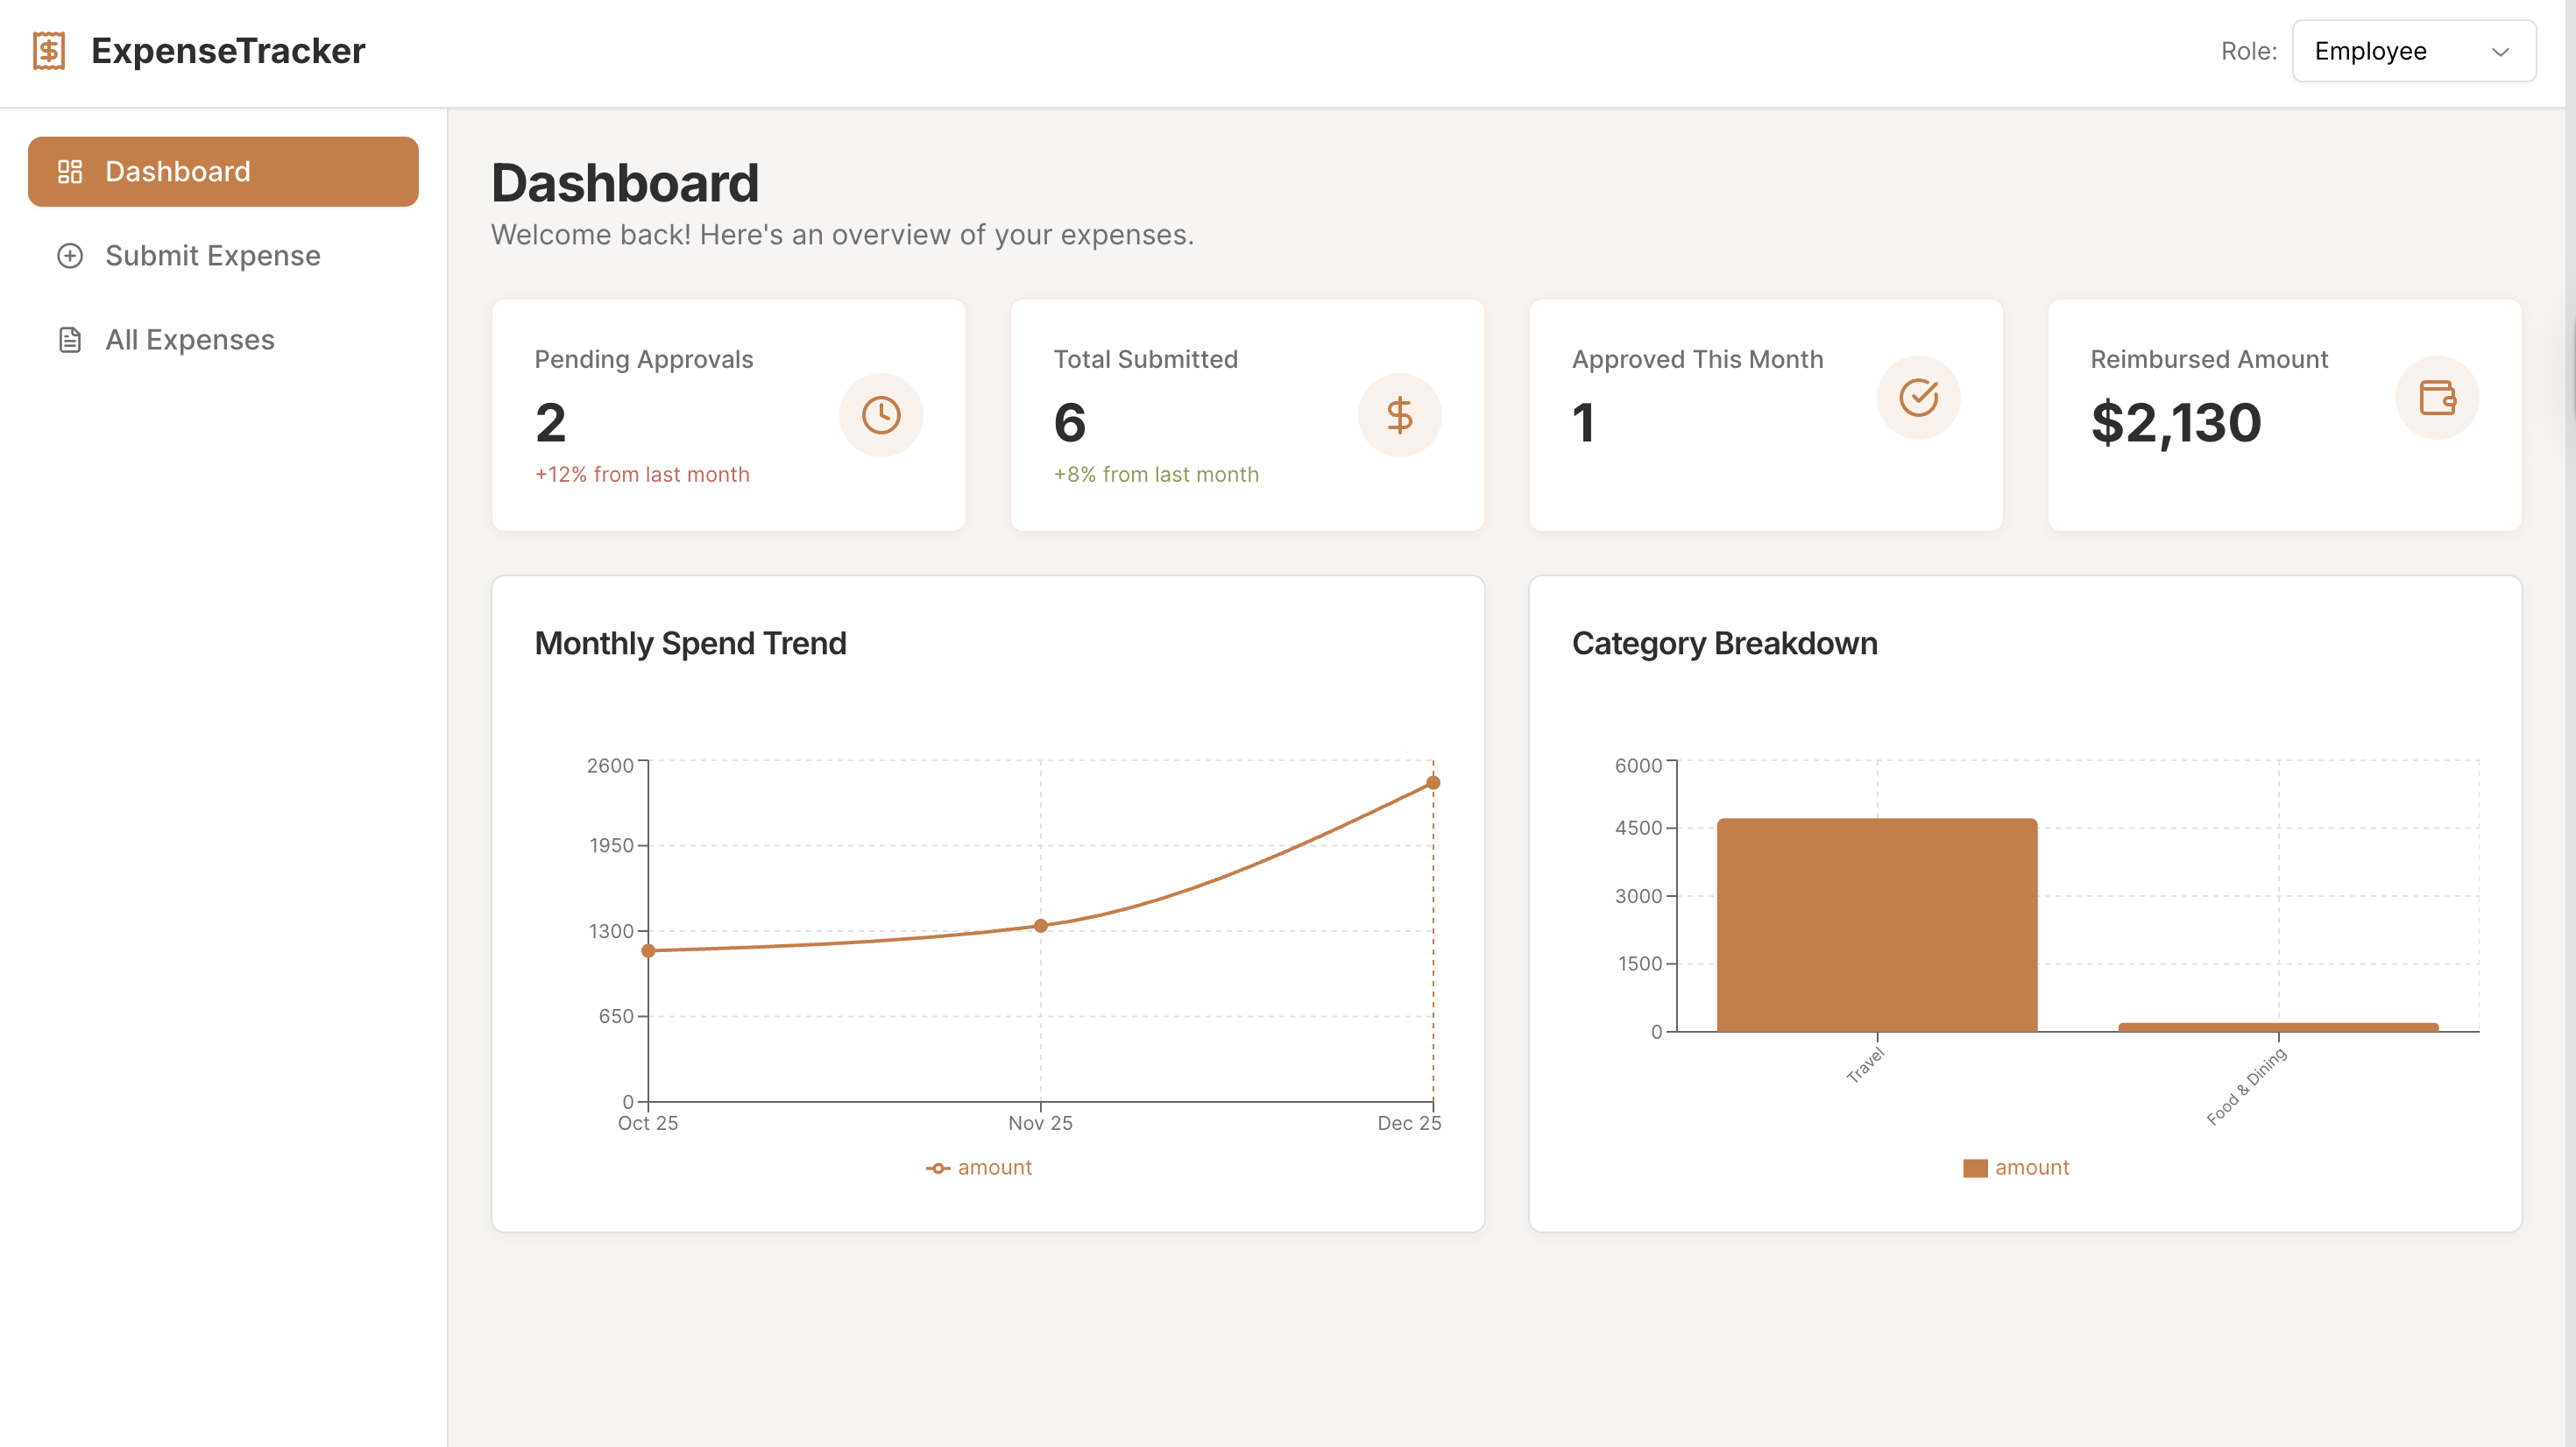
Cross-Functional Analytics
Combine insights from sales, marketing, and operations in one platform. Identify correlations, monitor trends, and evaluate performance gaps to make informed, data-driven decisions across the business.
Use Cases
- Executive dashboards for monitoring company-wide performance and trends
- Sales and marketing analytics platforms for business development teams
- Operational performance tracking for warehouses, fulfillment centers, and supply chains
- Department-level insights and reporting for managers and team leads
- Custom business intelligence tools for fast decision-making and cross-department analysis
Start Building Your Own Data Analytics Dashboard
Use this Data Analytics Dashboard template as a foundation to create a fully custom analytics platform. Connect real-time sales, marketing, and operational data; monitor trends and performance across departments; automate reporting; and design interactive visualizations tailored to your organization’s workflow with UI Bakery’s low-code tools.
Understanding how the Data Analytics Dashboard Works
UI Bakery enables you to transform your data into dynamic internal tools, leveraging a combination of pre-built and customized components.
- To initiate, click "Sign up".
- Establish your organization and create app "From template"
- Customize your generated application visually by intuitively dragging and dropping components and crafting queries for your resources.
- Expand the capabilities of this application by linking to your personal database, kickstarting the development of robust internal tools.
Related Data Analytics Dashboard Templates


Related Data Analytics Dashboard Templates

"The UI Bakery platform offers a cost-effective approach to creating applications. With UI Bakery, you can achieve your app development goals without breaking the bank."
