Discover our case studies
Take a look at what we've already created – dive into our case studies to see how our solutions are transforming businesses and driving real results!
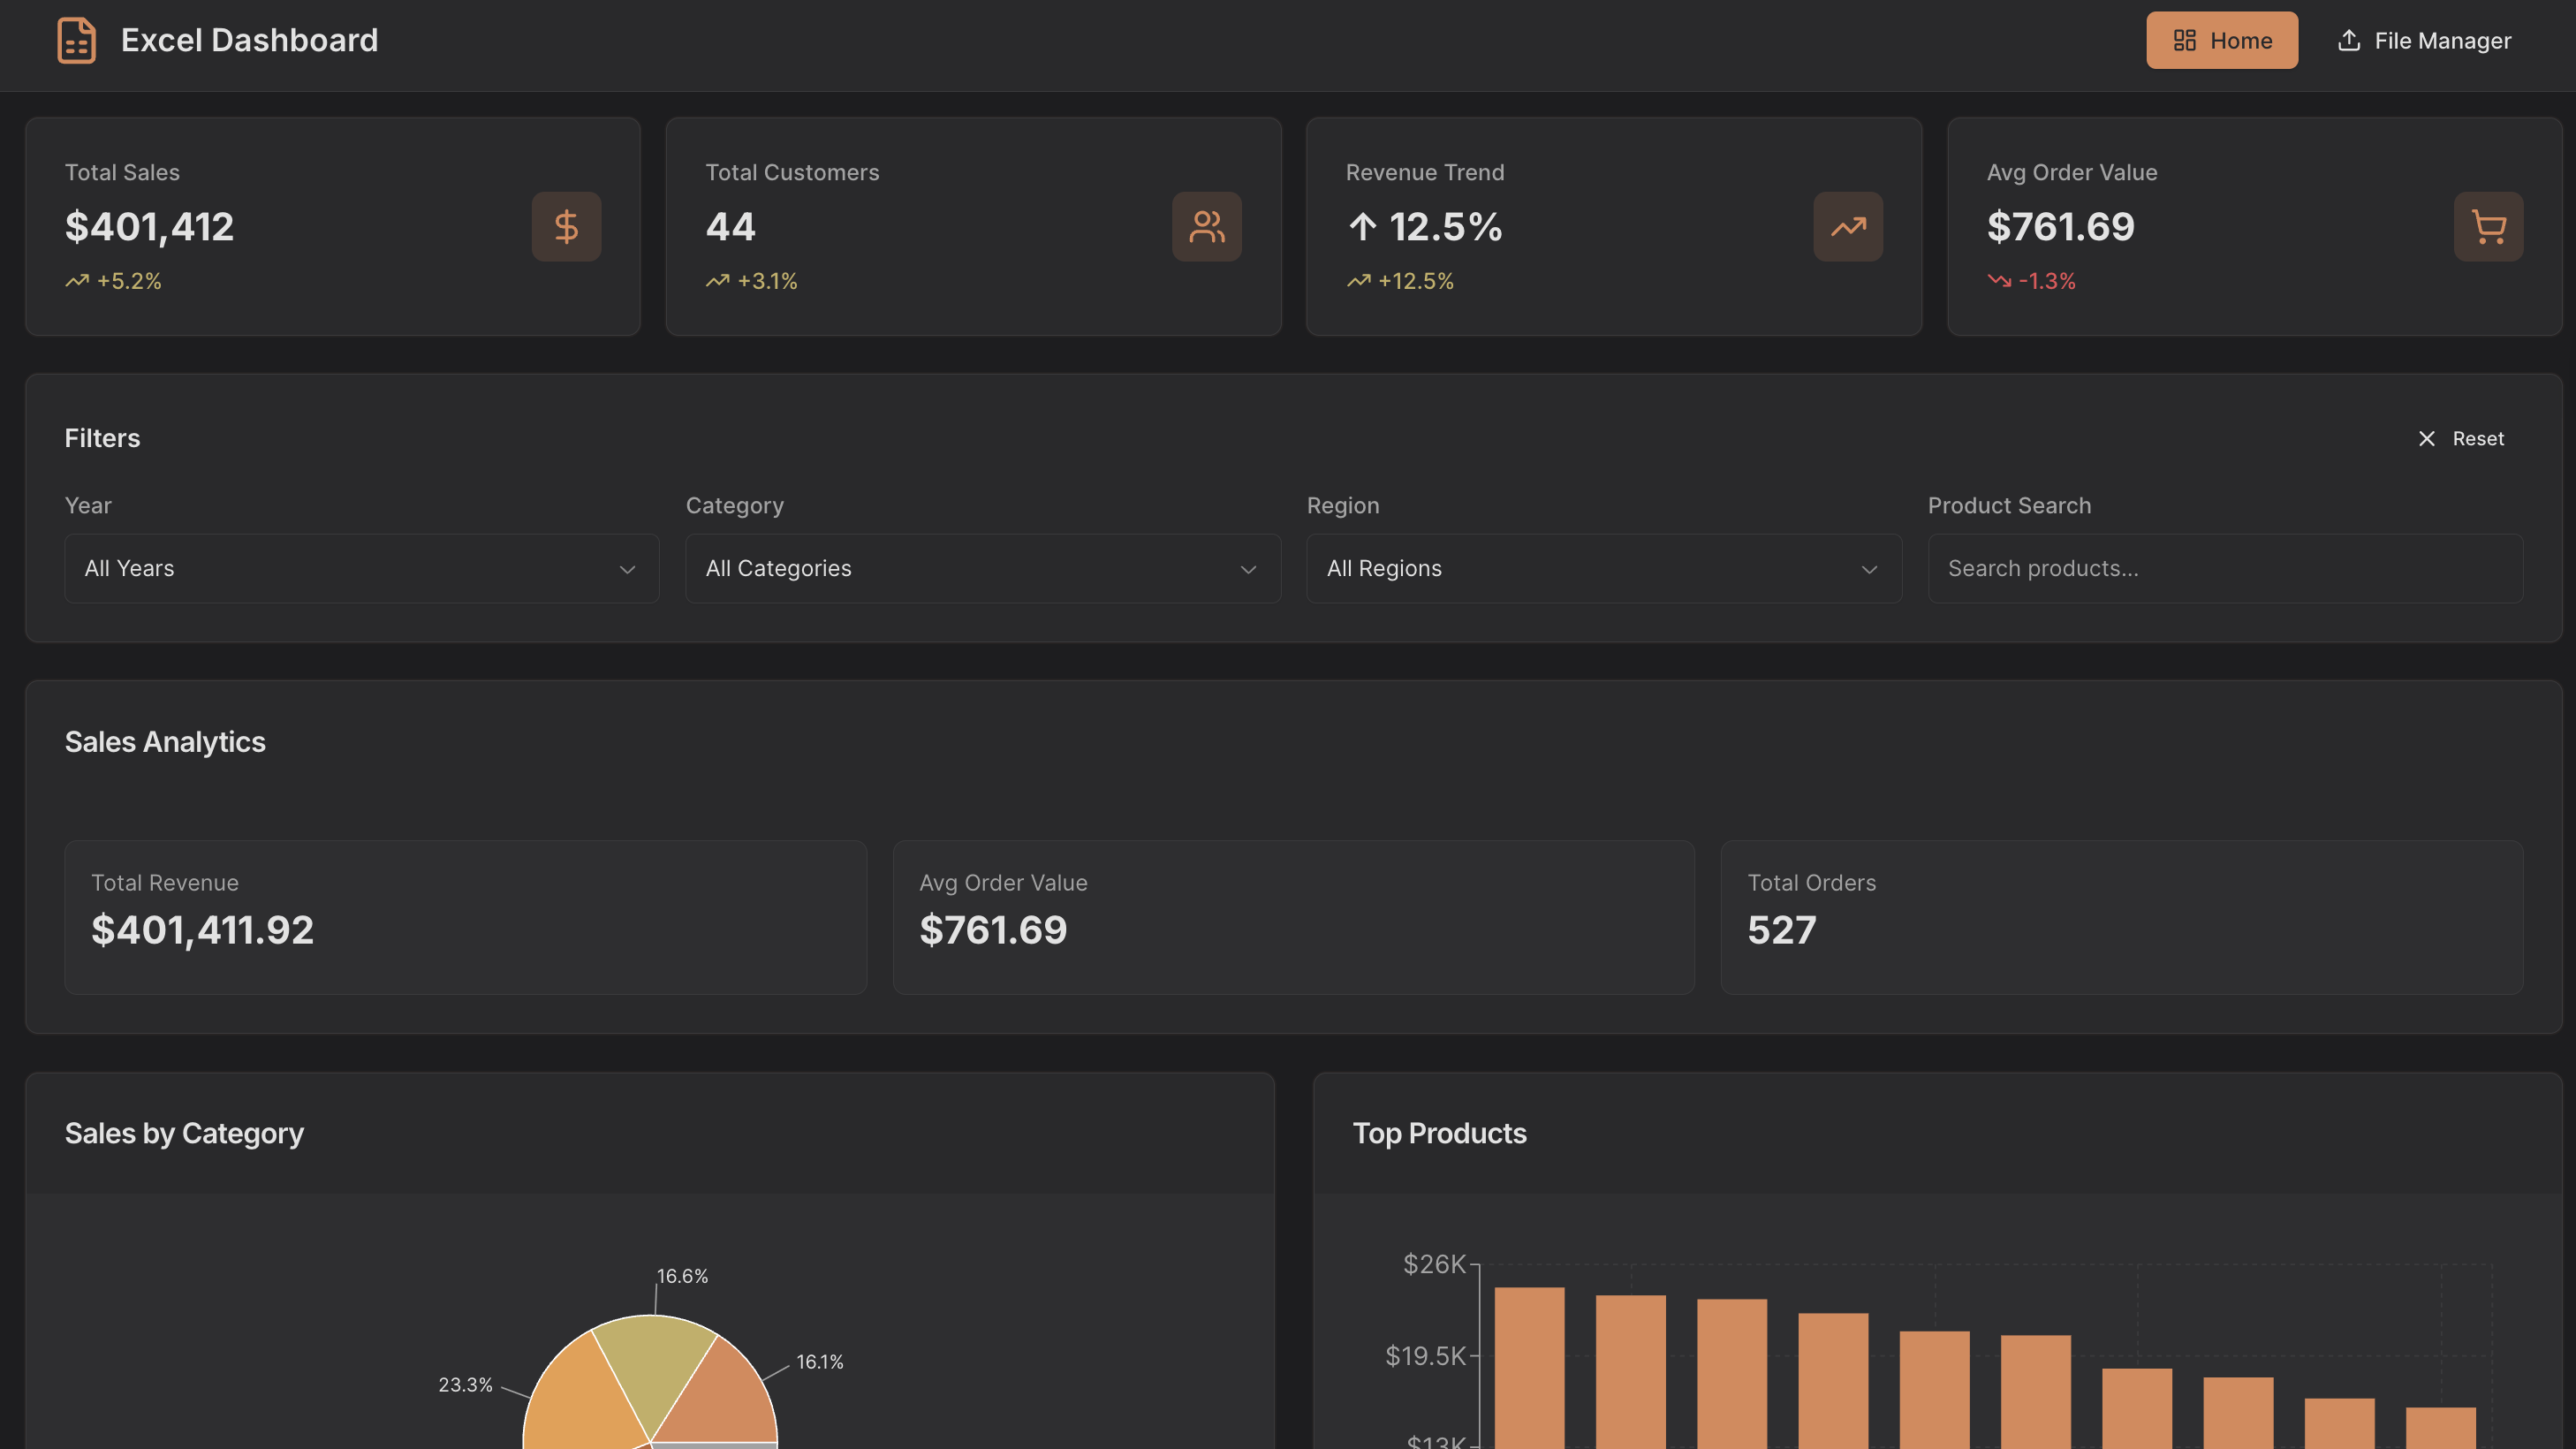
Building sales tools can be tricky, but UI Bakery has got you covered. With our low-code platform, you can develop a sales tool for your business 10x faster – easy and hassle-free!
Take a look at what we've already created – dive into our case studies to see how our solutions are transforming businesses and driving real results!

Find out how ProtectAll, one of the biggest US furniture providers, managed to improve their internal tooling and saved time on internal development twice.


Check out our sales tools templates:
Need assistance or have questions? Schedule a call with our support team. We're here to help!


Work with existing datasets or use the built-in UI Bakery database. The platform supports MySQL, PostgreSQL, CouchDB, MongoDB, Airtable, and more.

With UI Bakery’s low-code editor, creating intuitive admin panels is effortless. Use built-in themes to design beautiful interfaces in minutes.

UI Bakery offers a library of in-app automations to query, add, delete, and edit data. Integrate with Zapier, Webhooks, and third-party services to streamline workflows.

UI Bakery is built for scalability. Add users and expand functionality.
A sales tool is software designed to assist sales teams with lead management, sales tracking, customer relationship management (CRM), and performance analytics. It helps boost sales productivity and improve conversion rates.
Build internal tools significantly quicker with UI Bakery's drag-and-drop interface and pre-built components.
Ditch outdated internal systems and streamline development with UI Bakery's modern approach.
Maintain complete control over your data with self-hosting options and granular role-based permissions.
Need to accommodate a large team? Our unlimited plans keep your costs predictable, no matter how many users you need. See how UI Bakery's pricing plans fit your budget.


.png)