Excel Dashboard

Overview
Visualize and manage your business metrics with a modern, spreadsheet-inspired interface.
The Excel Dashboard centralizes sales, customer, and file management data into one interactive platform, combining KPI tracking, dynamic analytics, and file handling capabilities for fast, data-driven decisions.
Key Features
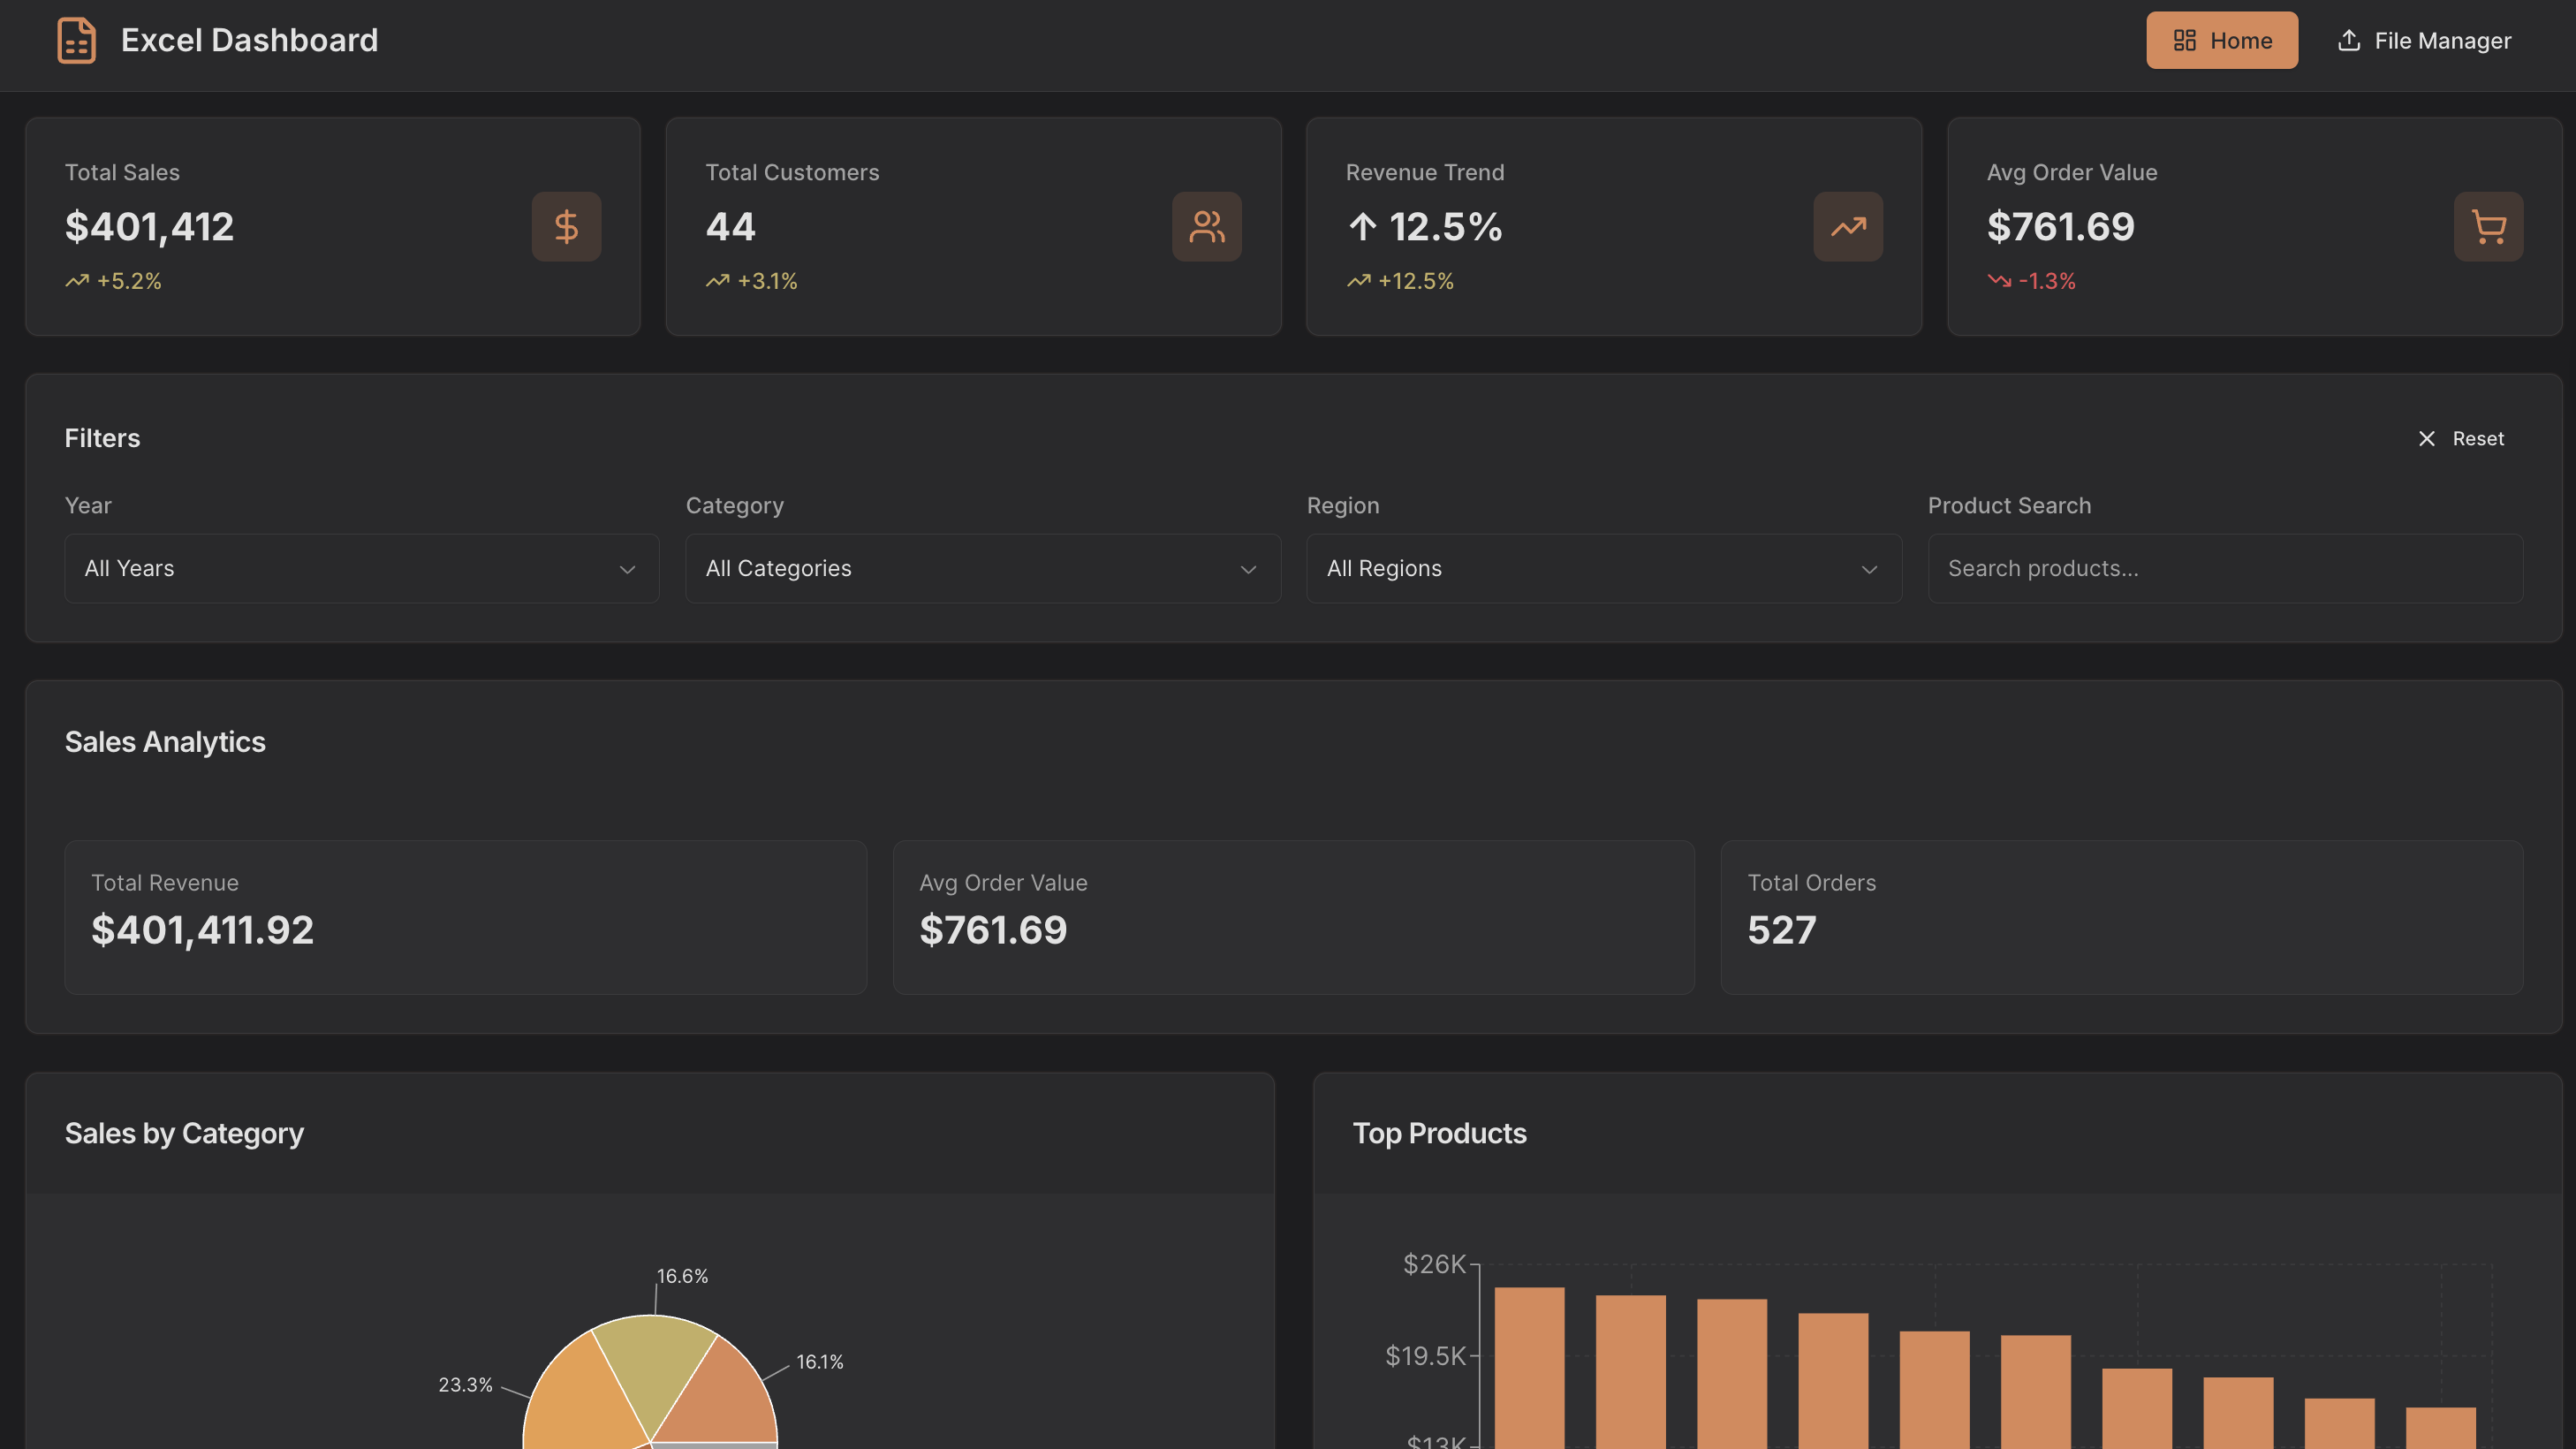
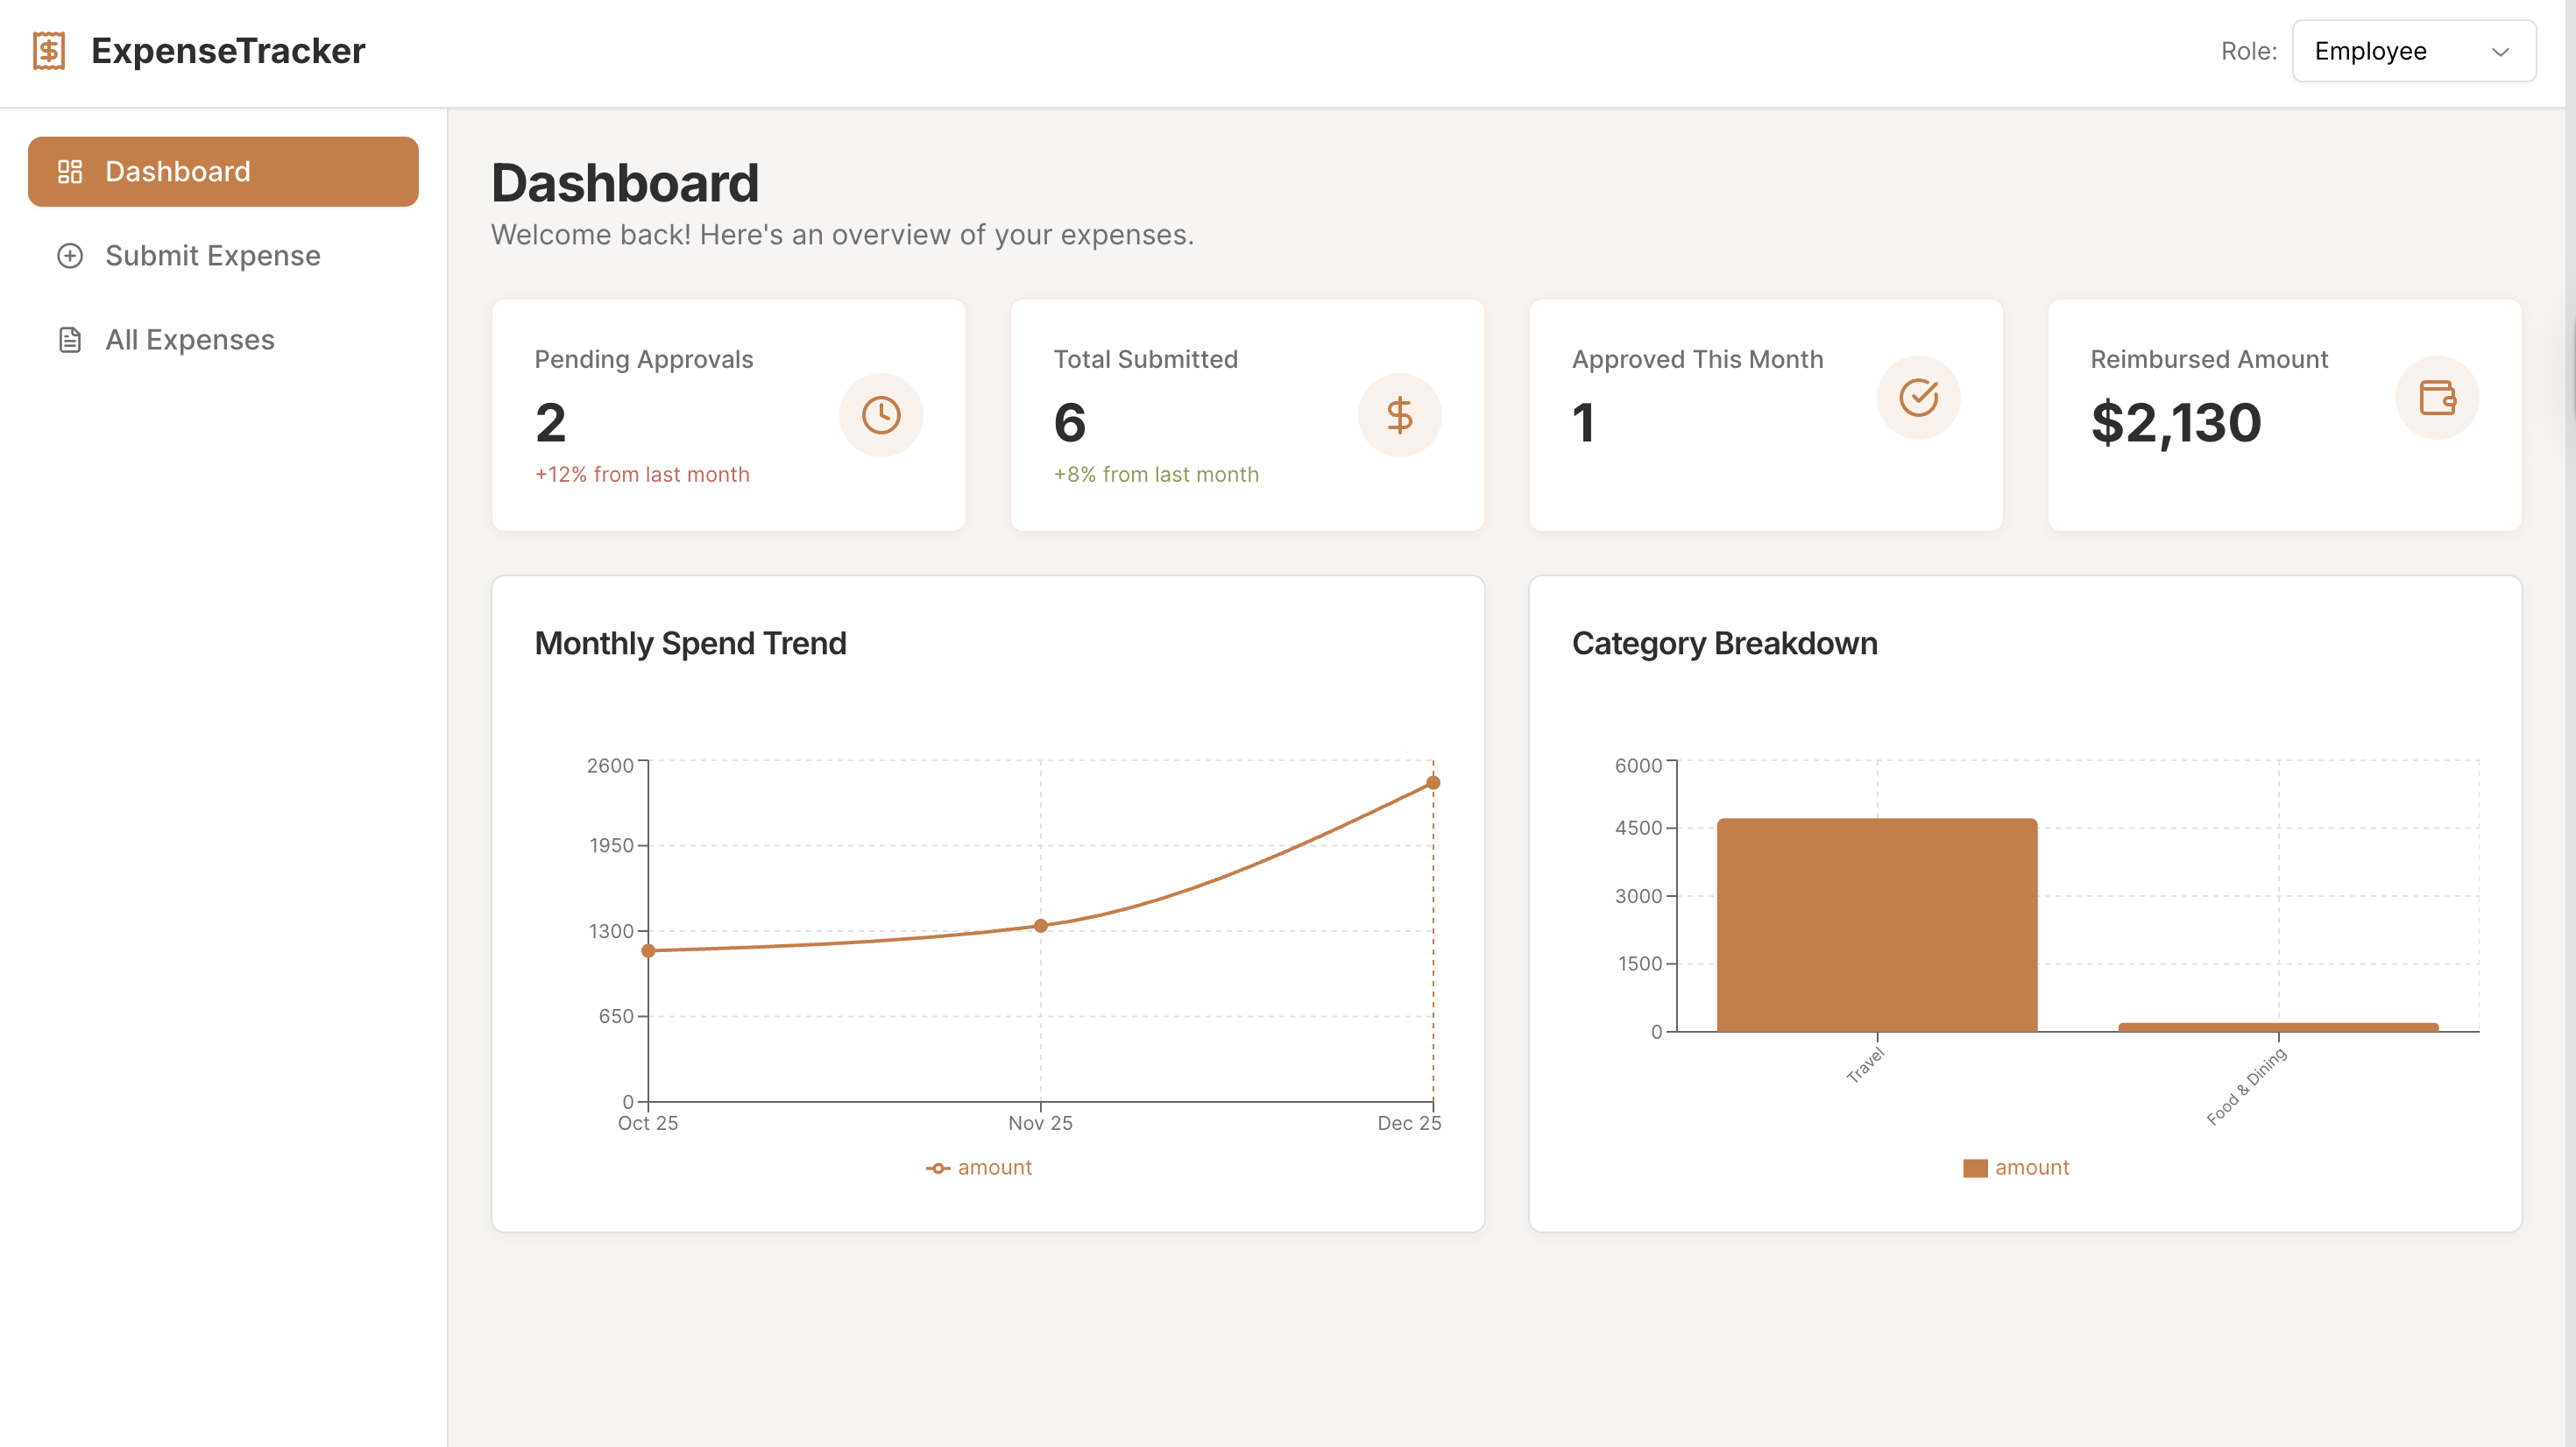
Interactive Analytics Dashboard
Track total sales, total customers, revenue trends, average order value, and other key metrics in a single, intuitive interface. Drill into charts and maps to explore trends, comparisons, and growth over time.
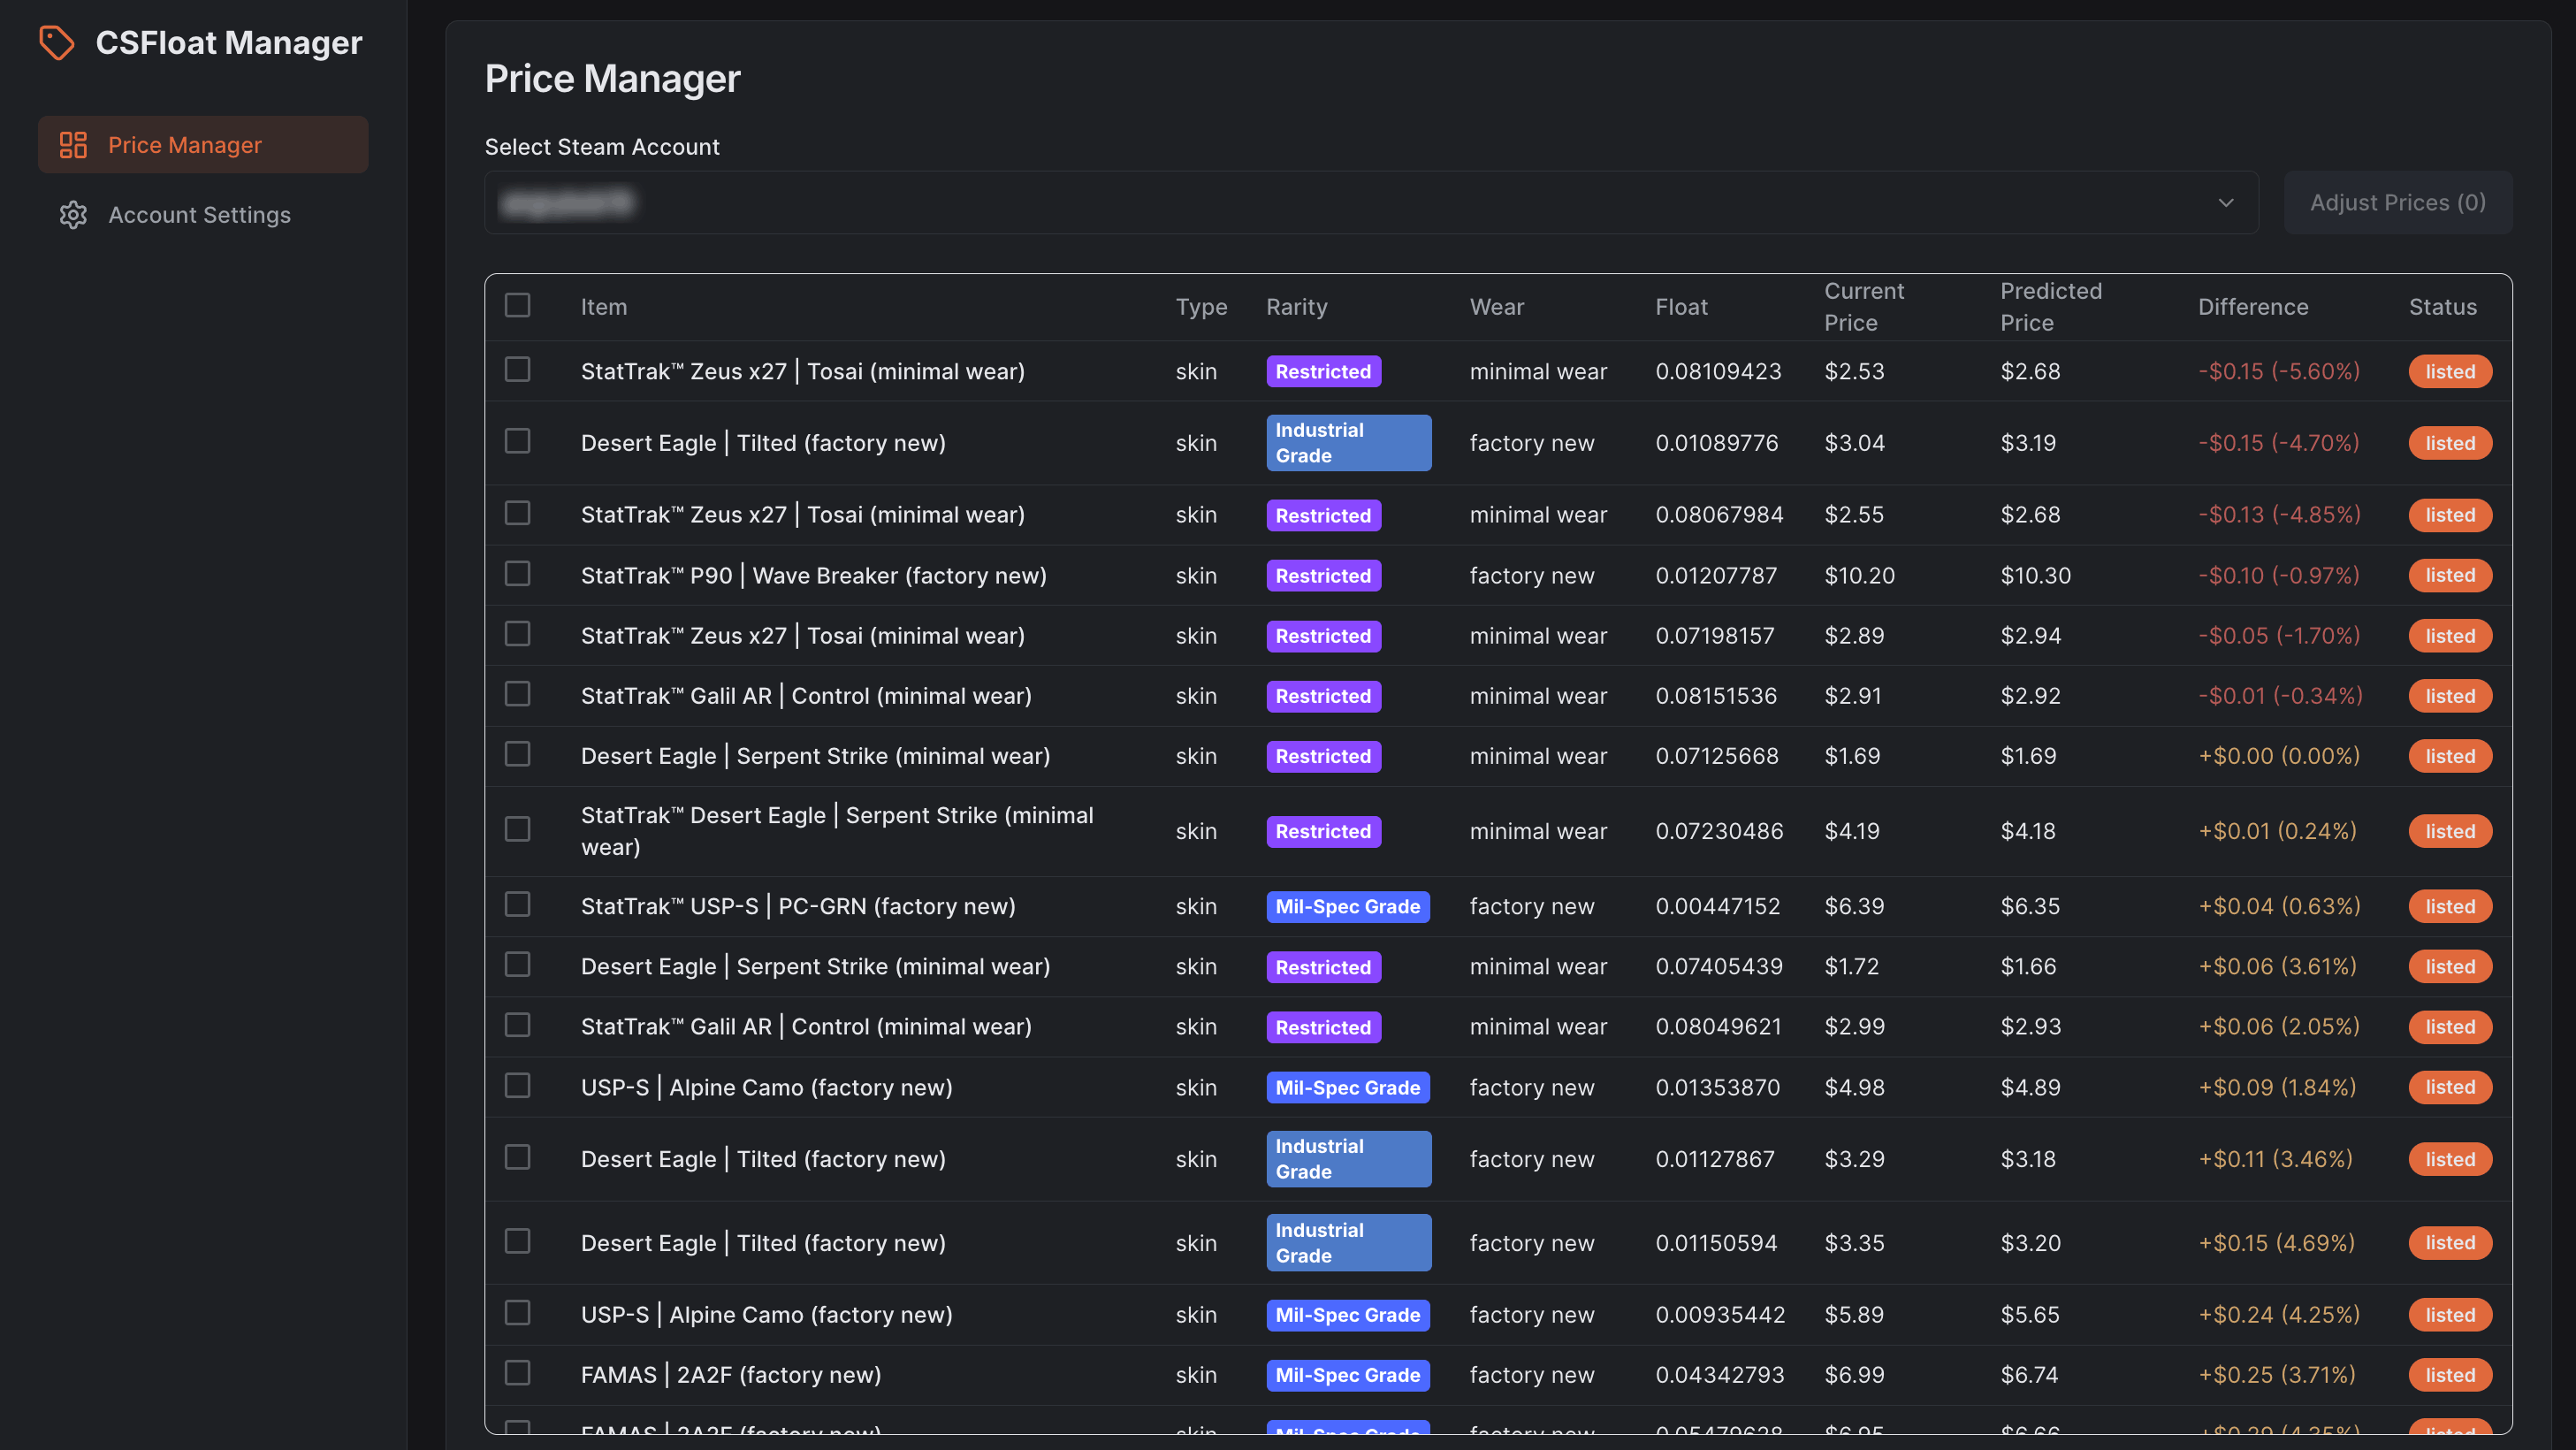
Sales & Customer Insights
Analyze sales performance by category, top products, and payment methods, while monitoring customer segments, retention indicators, and geographic distribution on an interactive map.
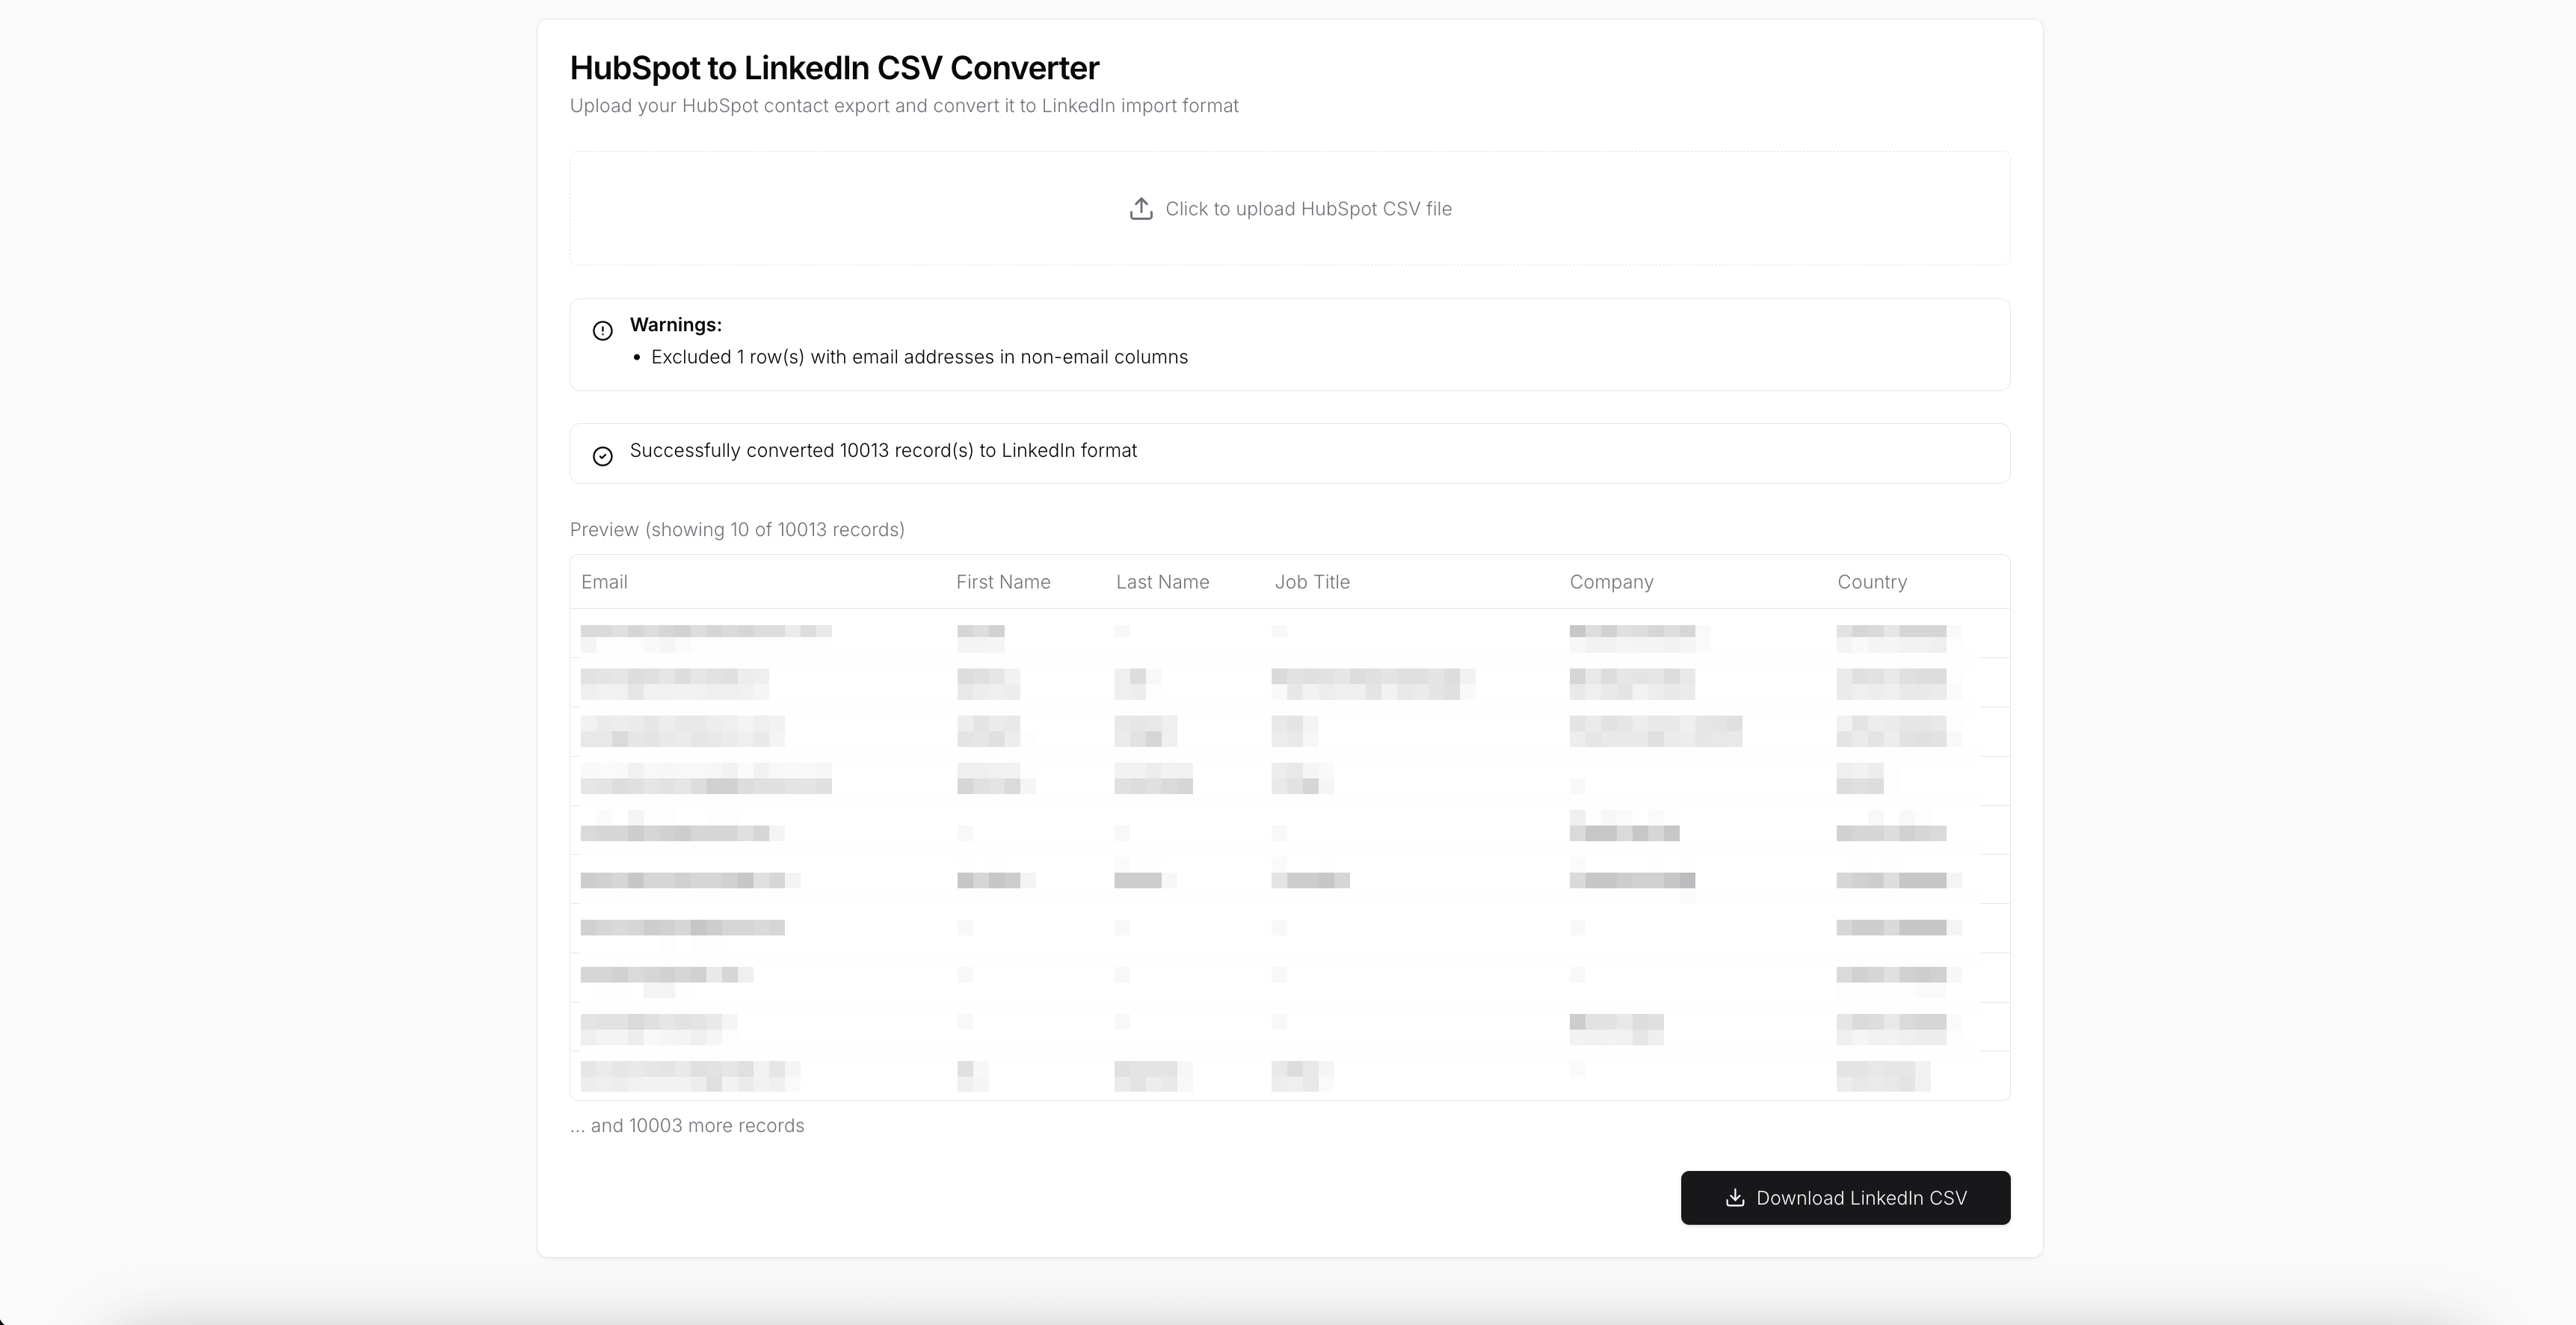
File Upload & Management
Easily upload, preview, and manage files from your connected API. Sort, filter, and search through files, and quickly view metadata or extracted data for informed decisions.
Dynamic Filters & KPI Cards
Apply filters by date, category, region, or product to instantly update analytics and KPIs, ensuring the dashboard reflects the most relevant information.
Use Cases
- Sales performance dashboards for e-commerce or retail teams
- Customer analytics hubs for marketing and growth teams
- File management platforms integrated with API-driven datasets
- Internal tools for operations teams to track metrics and uploads
- Business intelligence dashboards for real-time data monitoring
Start Building Your Own Excel Dashboard
Use this Excel Dashboard template as a foundation to create a fully custom analytics and file management platform. Connect live sales, customer, and file data, monitor trends, visualize insights, and design workflows tailored to your operational needs with UI Bakery’s low-code tools.
How the Excel Dashboard template works
UI Bakery enables you to transform your data into dynamic internal tools, leveraging a combination of pre-built and customized components.
- To initiate, click "Sign up".
- Establish your organization and create app "From template"
- Customize your generated application visually by intuitively dragging and dropping components and crafting queries for your resources.
- Expand the capabilities of this application by linking to your personal database, kickstarting the development of robust internal tools.
Related Excel Dashboard templates


Related Excel Dashboard templates

"The UI Bakery platform offers a cost-effective approach to creating applications. With UI Bakery, you can achieve your app development goals without breaking the bank."
