Hubspot Dashboard

Overview
Track your sales performance and pipeline health in one centralized CRM analytics workspace.
The HubSpot Dashboard helps revenue teams understand deal progress, forecast outcomes, and evaluate team effectiveness through clear performance insights across leads, opportunities, and closed deals.
Key Features
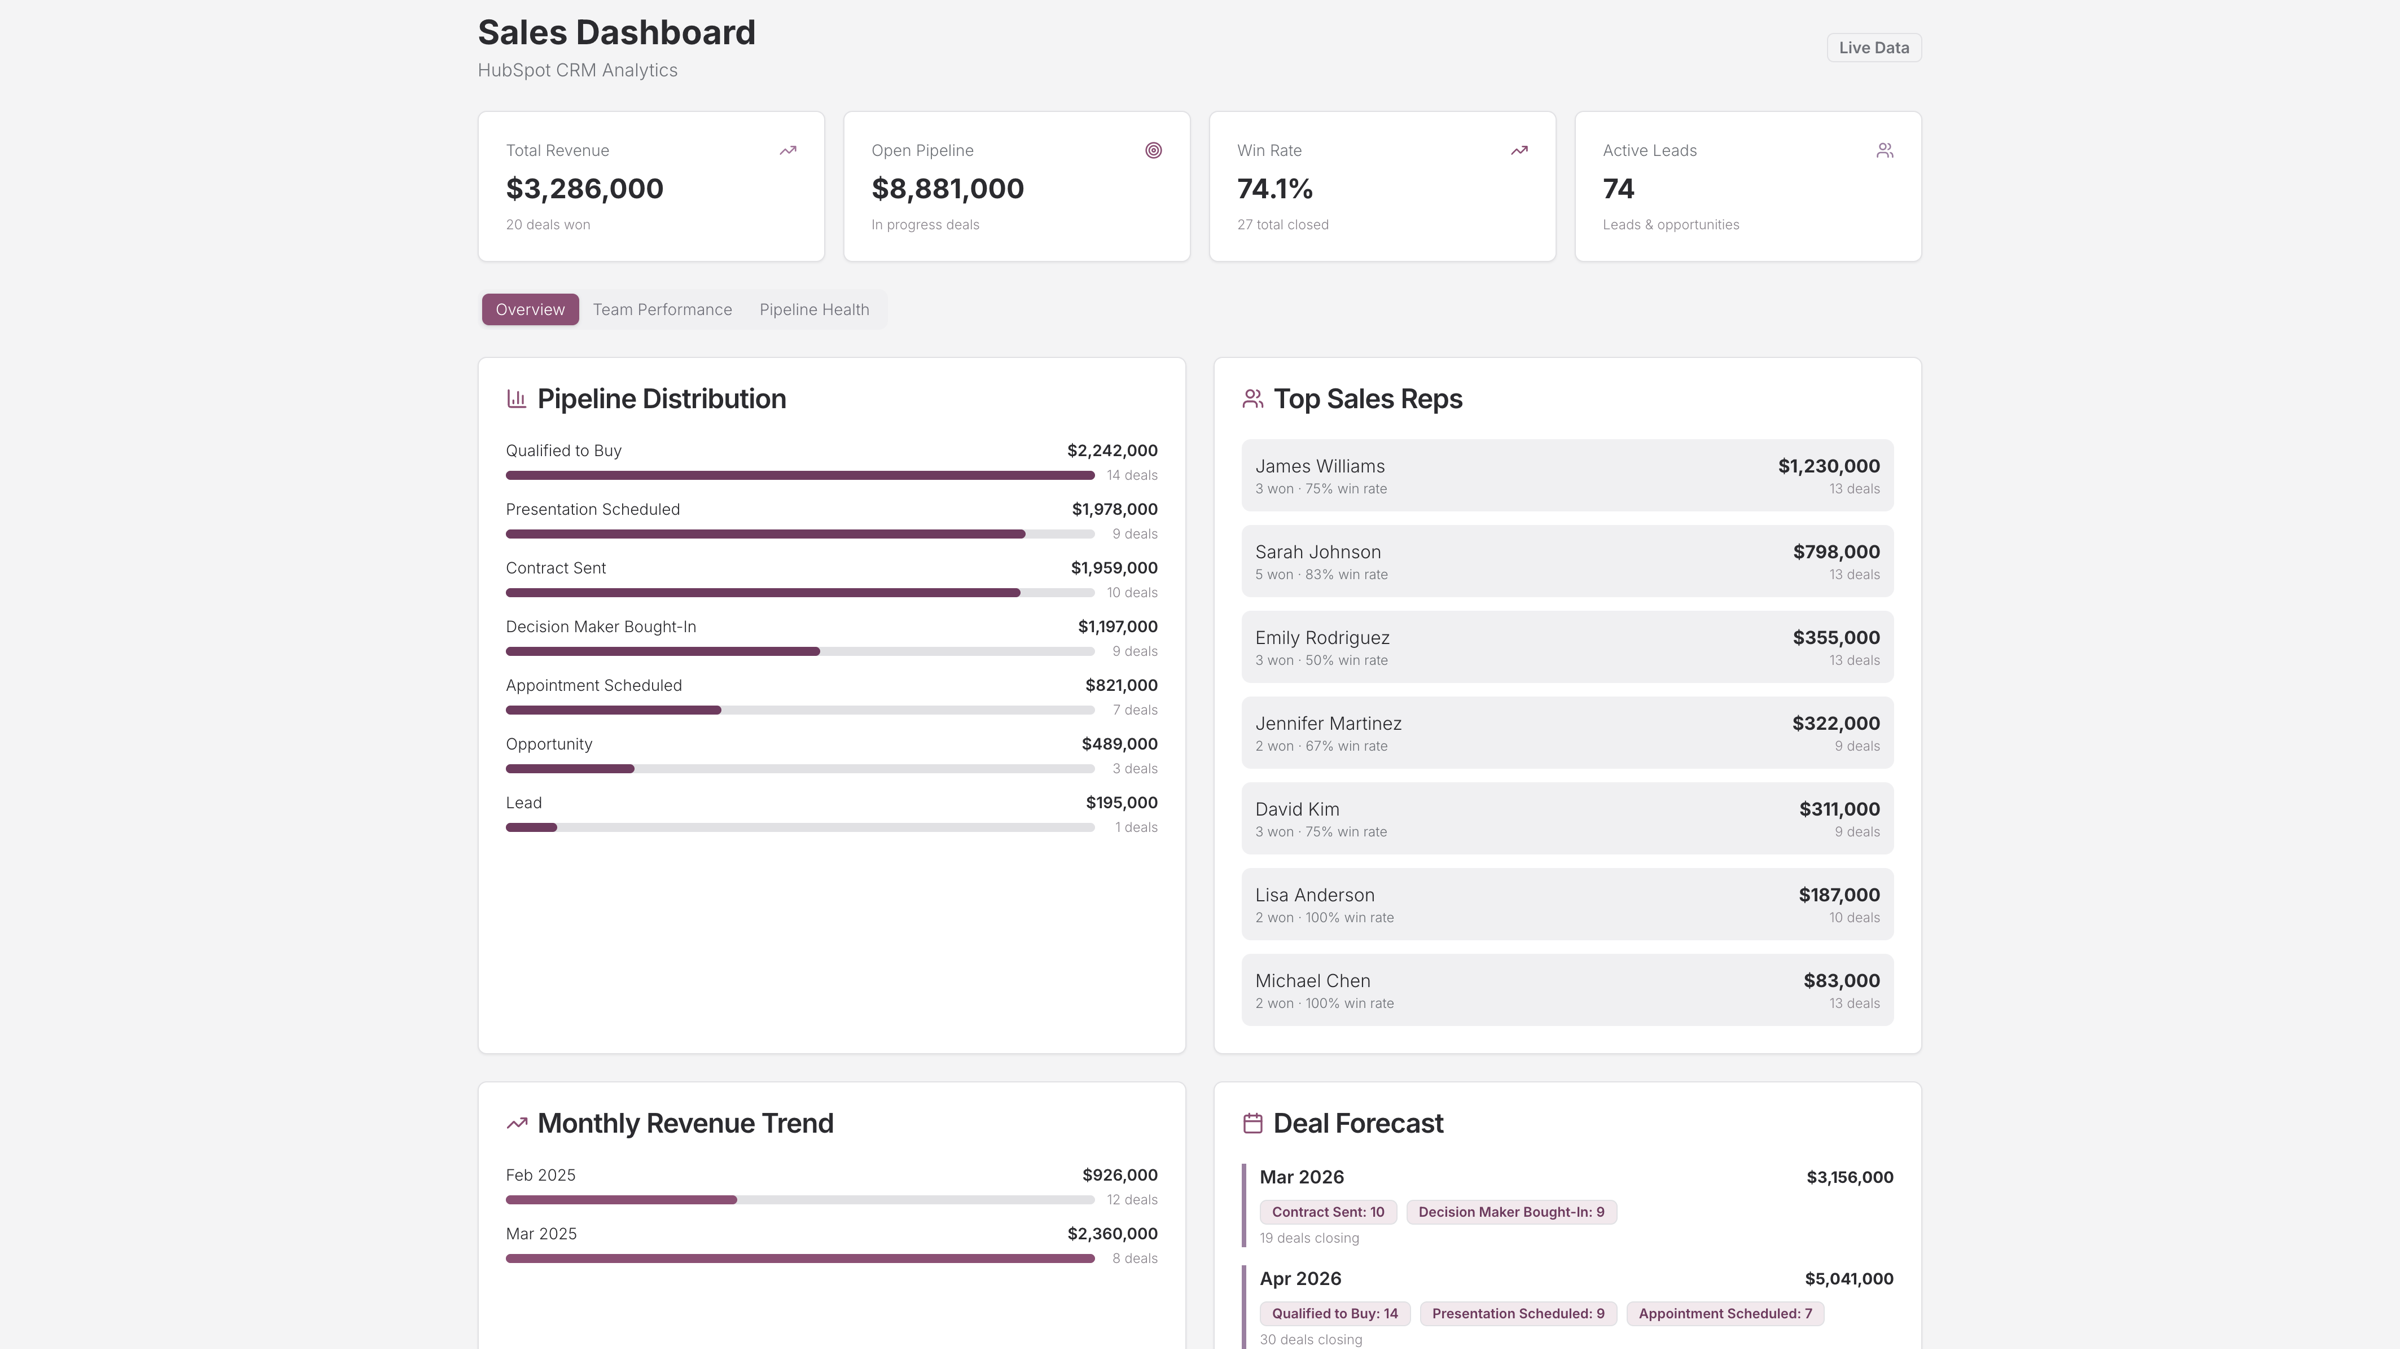
Unified Sales KPIs
Consistent KPI cards across all pages showing total revenue (won deals), open pipeline value, win rate, and active leads & opportunities.
Pipeline & Revenue Insights
Visualize pipeline distribution by stage, monthly revenue trends, and deal forecasts to understand expected closings and revenue projections.
Sales Team Performance Analytics
Evaluate individual sales rep performance with metrics including total deals, deals won, win rate, average deal size, and revenue contribution.
Pipeline Health Monitoring
Track funnel performance, stage conversion rates, deal velocity, and compare pipeline outcomes across won, open, and lost deals.
Use Cases
- Sales leadership dashboards for revenue forecasting
- CRM analytics for SaaS and B2B sales teams
- Performance monitoring for account executives and managers
- Pipeline analysis tools for sales operations teams
Start Building Your Own HubSpot Dashboard
Use this HubSpot Dashboard template to analyze deal progress, measure sales effectiveness, and forecast revenue. Connect your CRM data to monitor pipeline performance and empower your team with actionable sales insights.
How the Hubspot Dashboard works
UI Bakery enables you to transform your data into dynamic internal tools, leveraging a combination of pre-built and customized components.
- To initiate, click "Sign up".
- Establish your organization and create app "From template"
- Customize your generated application visually by intuitively dragging and dropping components and crafting queries for your resources.
- Expand the capabilities of this application by linking to your personal database, kickstarting the development of robust internal tools.
Related Hubspot Dashboard templates


Related Hubspot Dashboard templates

"The UI Bakery platform offers a cost-effective approach to creating applications. With UI Bakery, you can achieve your app development goals without breaking the bank."
