Financial Dashboard


Overview
Monitor your company’s finances with clarity and confidence.
This Financial Dashboard template helps teams track revenue, expenses, profit margins, and financial trends - all from a single, interactive workspace designed for fast, accurate decision-making. With real-time updates, customizable views, and a secure admin panel, it provides complete financial visibility for both everyday users and administrators.
Key Features
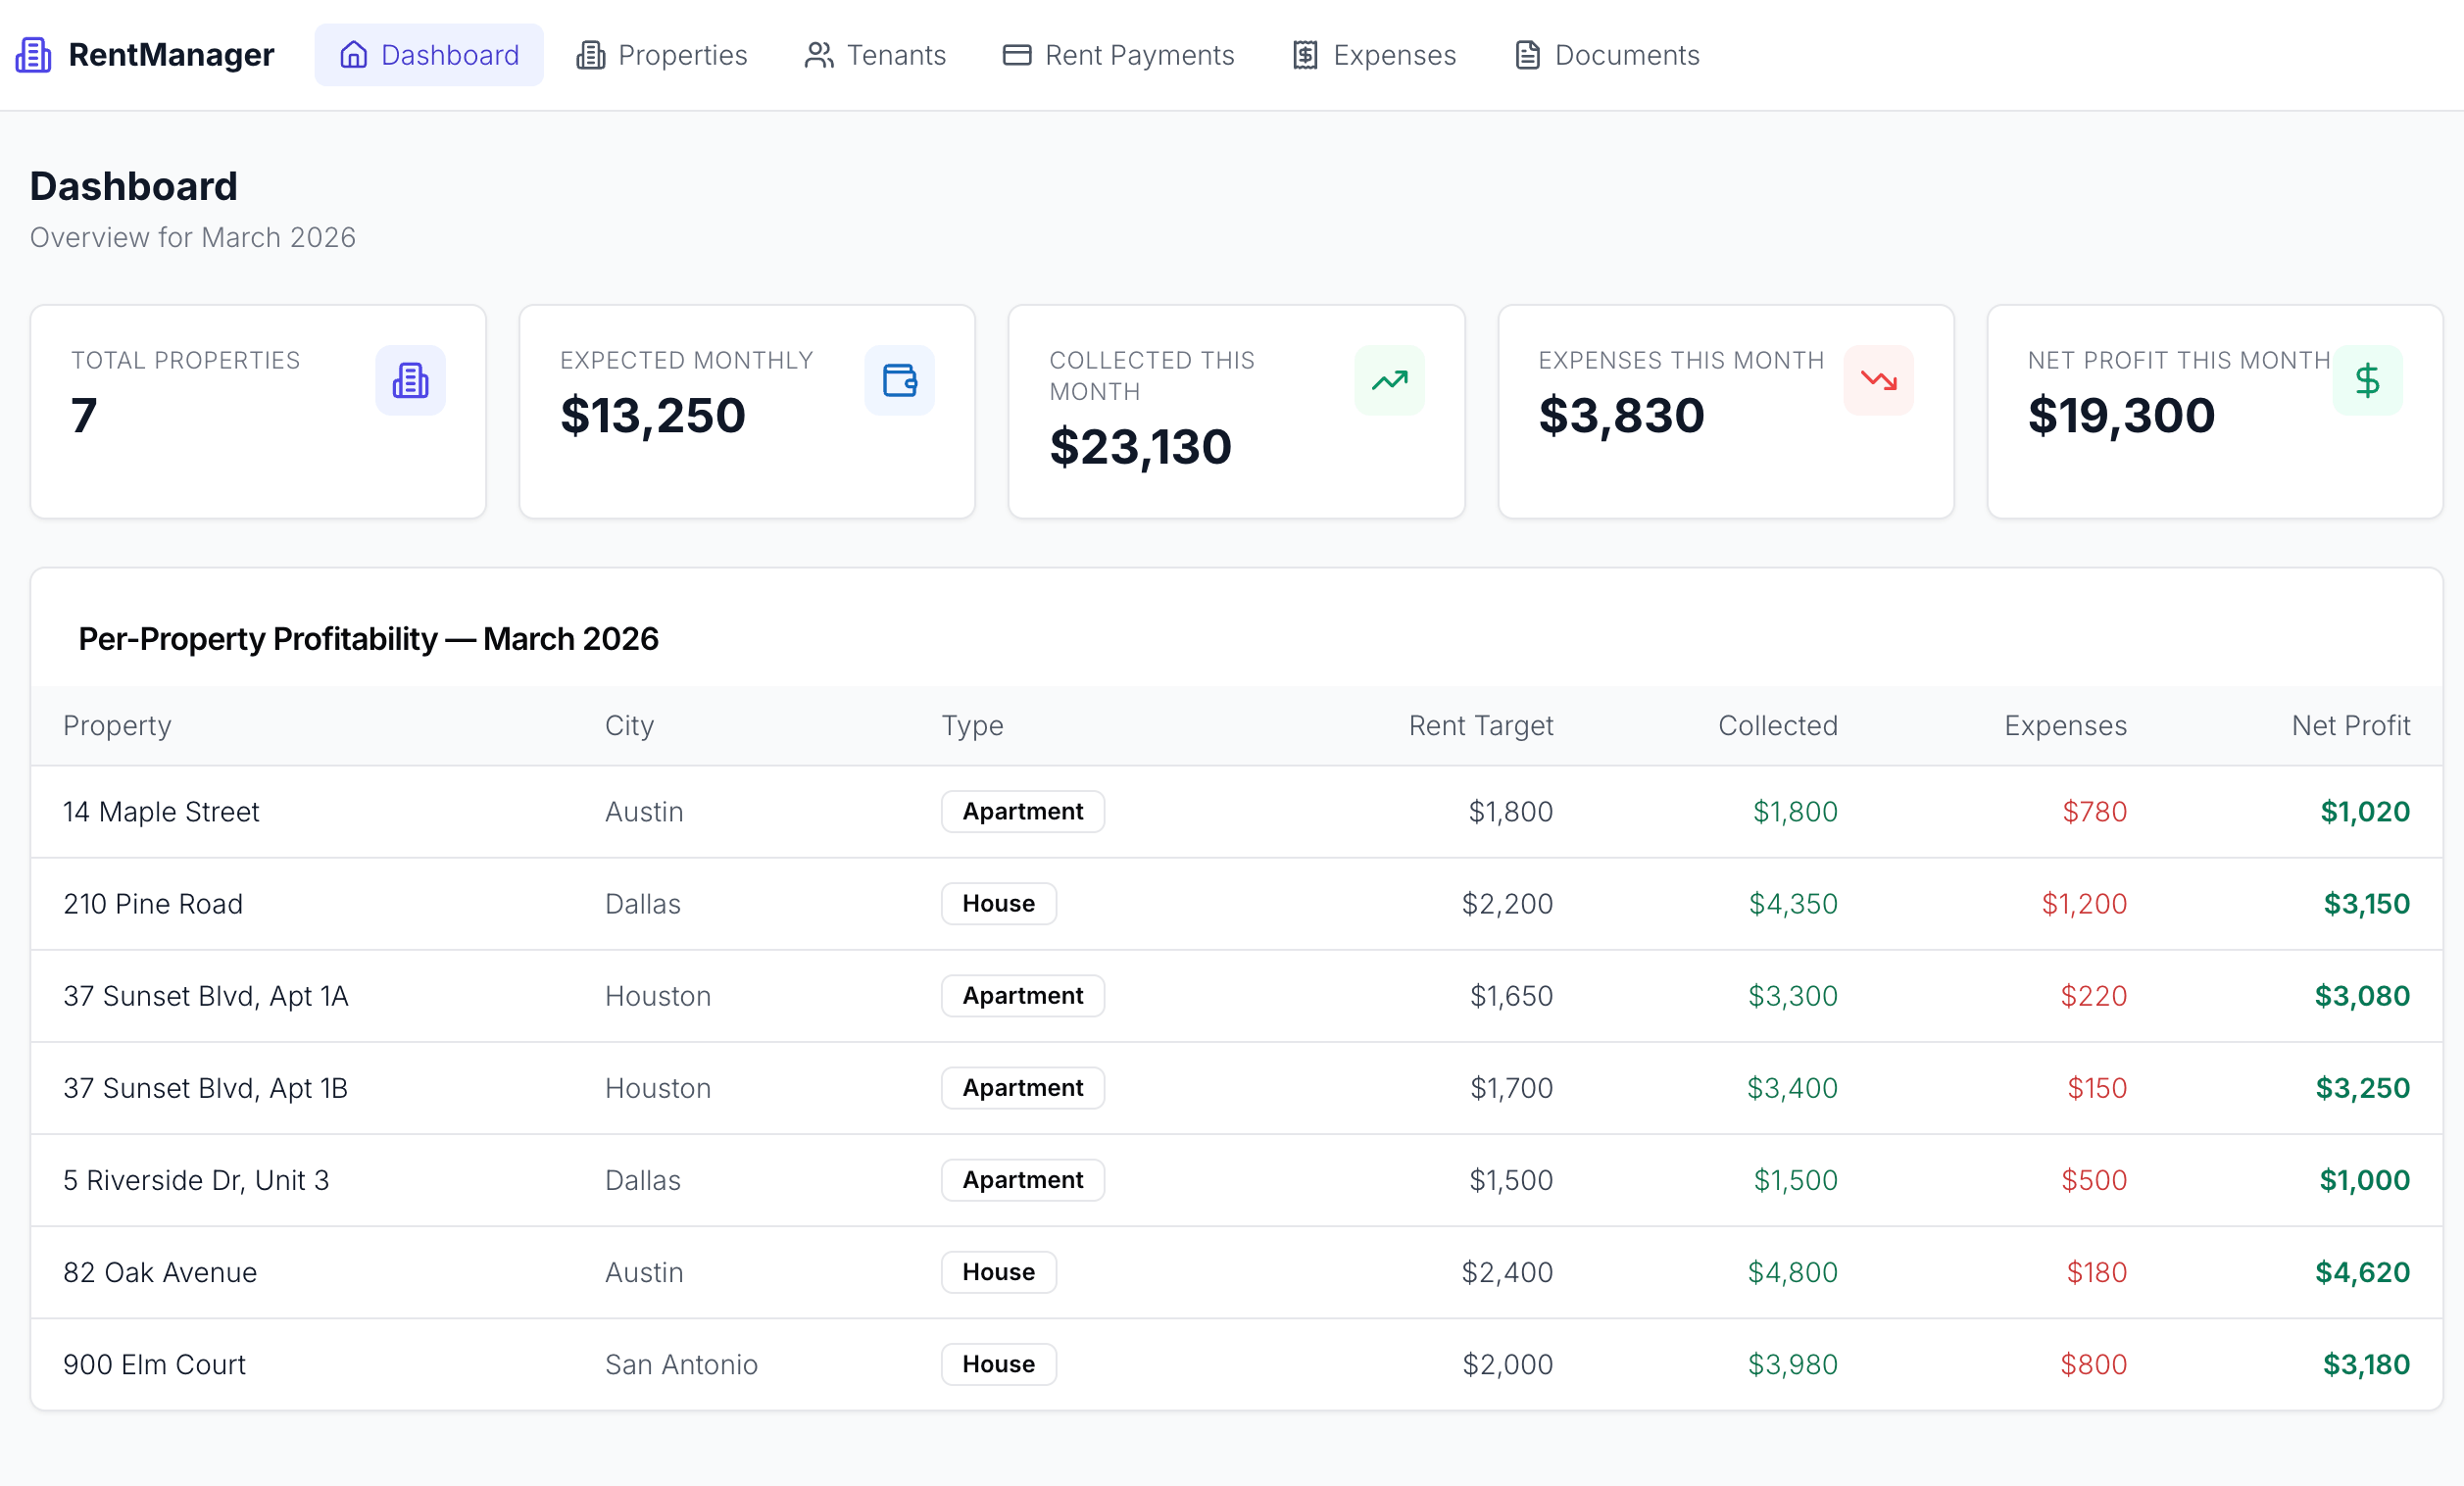
Financial Trends & KPI Overview
Track core financial metrics - total revenue, total expenses, net profit, and profit margin - supported by interactive line and bar charts. Visualize revenue and expense trends, category-level spending, department budgets, profit margins, month-over-month comparisons, and the top 10 transactions for instant financial insight.
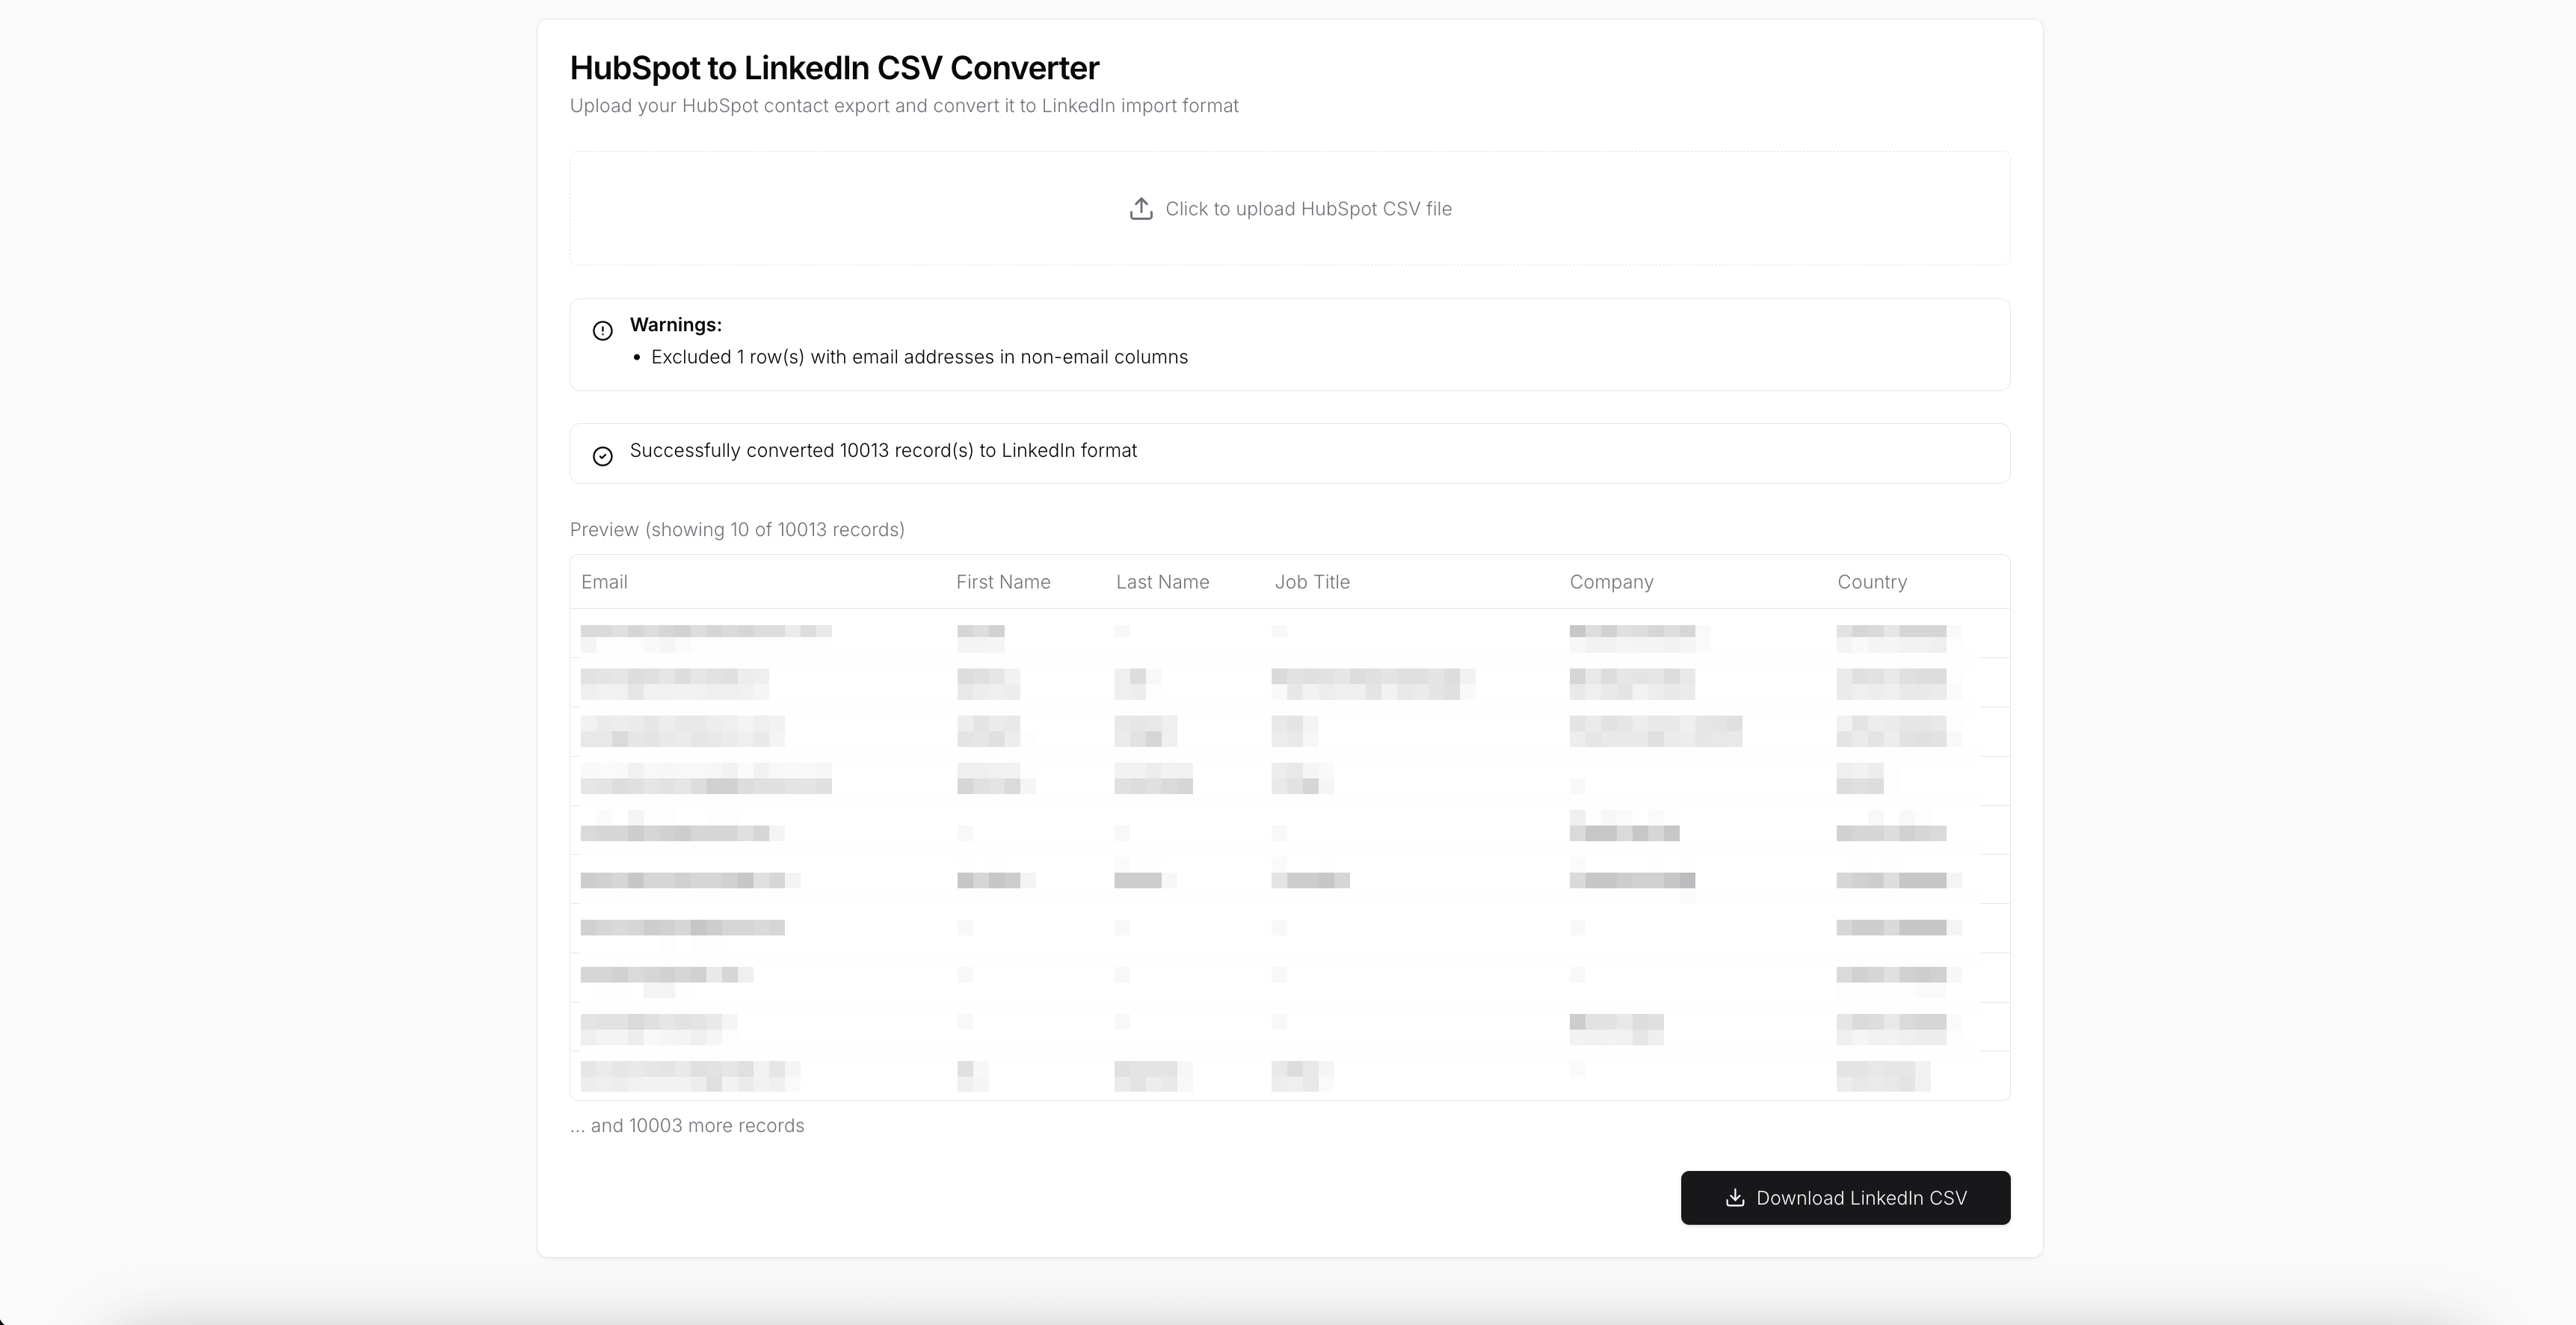
Filterable Transactions & Reports
Dive into your financial records through dynamic tables that can be sorted and filtered by date, category, or department. Quickly review transaction details or navigate the menu to access income statements, balance sheets, and cash flow reports. All reports support time-based filtering and can be exported to PDF or Excel with one click.
Role-Based Admin Panel
Manage users, permissions, and financial settings through a dedicated admin view. Configure roles to control who can edit data, update reports, or access department-level information. Admins can also toggle interface elements and customize available widgets.
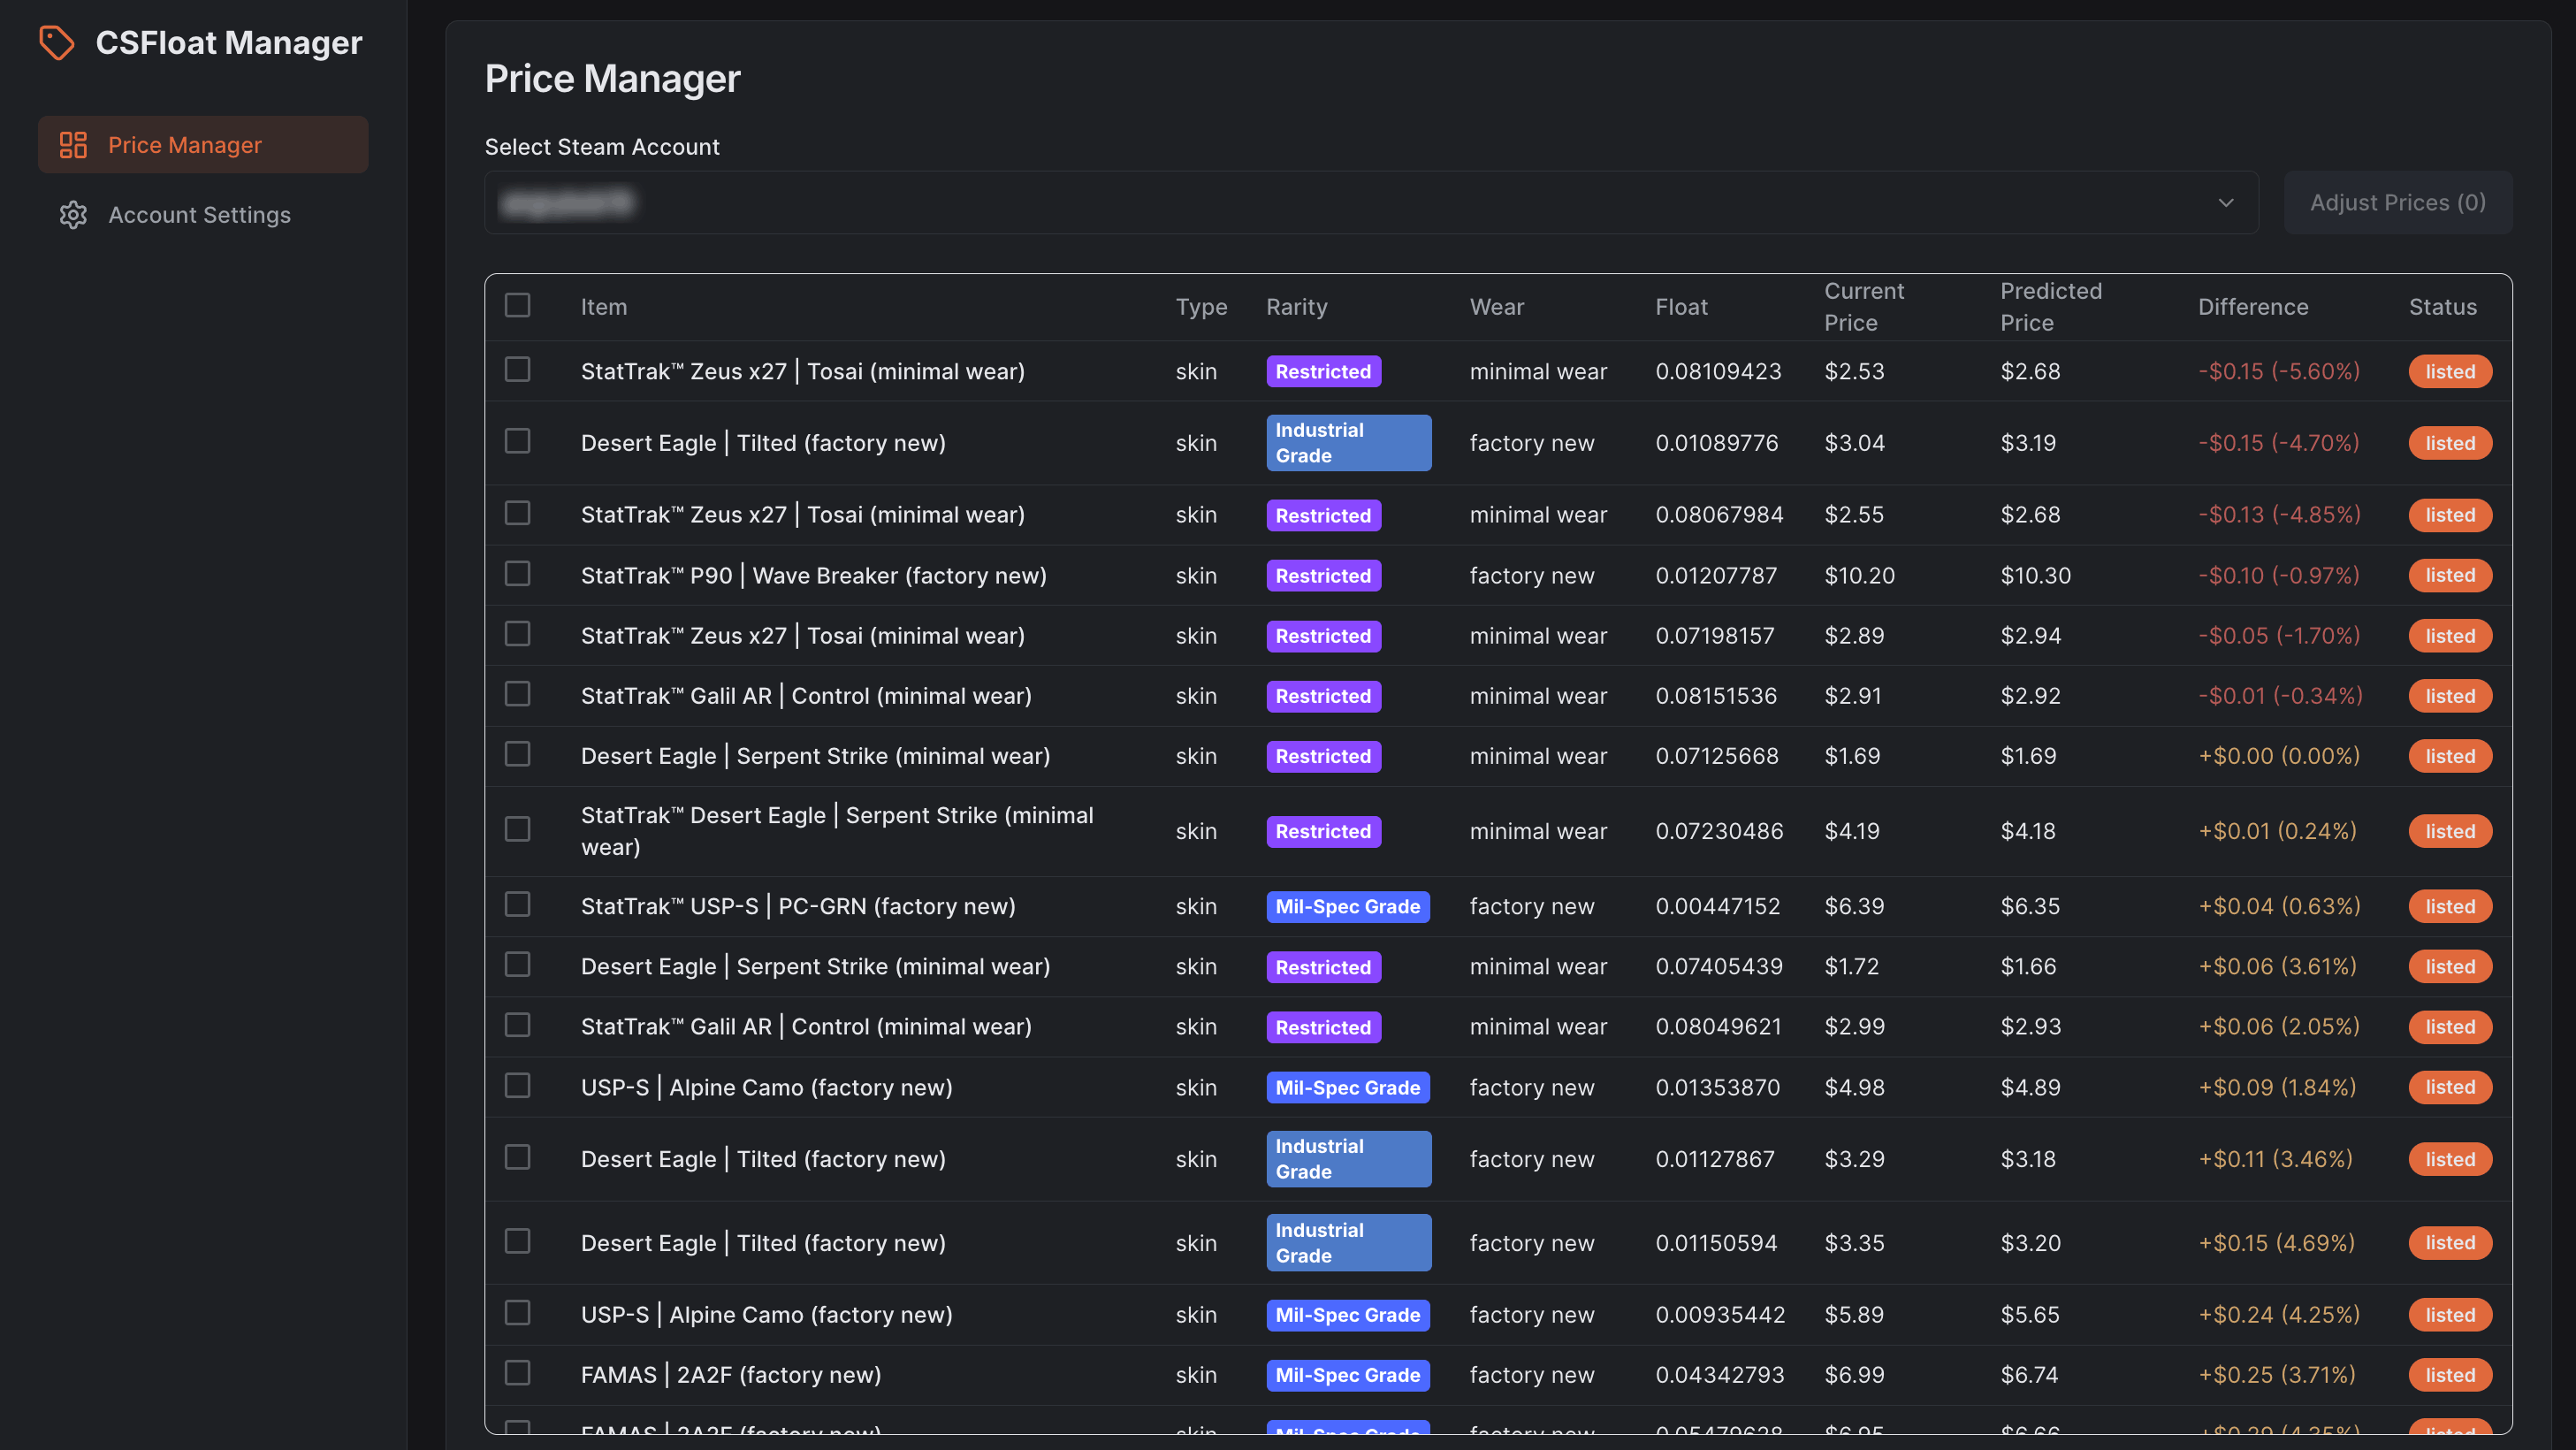
Financial Data Management
Add, edit, or remove transactions, expense categories, and budget entries. The admin panel provides full CRUD capabilities, enabling rapid testing and maintenance of financial structures.
Monitoring, Alerts & Audit Logs
Stay informed with automatic alerts for anomalies, threshold breaches, or unusual activity. The built-in activity log records all user actions for compliance and visibility, with the option to export logs to CSV for offline review or auditing.
Use Cases
- Financial dashboards for small to medium businesses
- Internal finance tools for accounting or FP&A teams
- Budget management systems for departments and cost centers
- Executive reporting dashboards with real-time insights
- Finance portals for operational monitoring across revenue, spending, and profitability
Start Building Your Own Financial Dashboard
Use this Financial Dashboard template as the foundation for a fully customized financial reporting and management system. Easily extend it with your own data sources, business logic, approval workflows, advanced forecasting, or integrations - all built visually with UI Bakery’s low-code platform.
How Financial Dashboard template works?
UI Bakery enables you to transform your data into dynamic internal tools, leveraging a combination of pre-built and customized components.
- To initiate, click "Sign up".
- Establish your organization and create app "From template"
- Customize your generated application visually by intuitively dragging and dropping components and crafting queries for your resources.
- Expand the capabilities of this application by linking to your personal database, kickstarting the development of robust internal tools.
Other Financial Dashboard templates


Other Financial Dashboard templates

"The UI Bakery platform offers a cost-effective approach to creating applications. With UI Bakery, you can achieve your app development goals without breaking the bank."
