Energy Dashboard

Overview
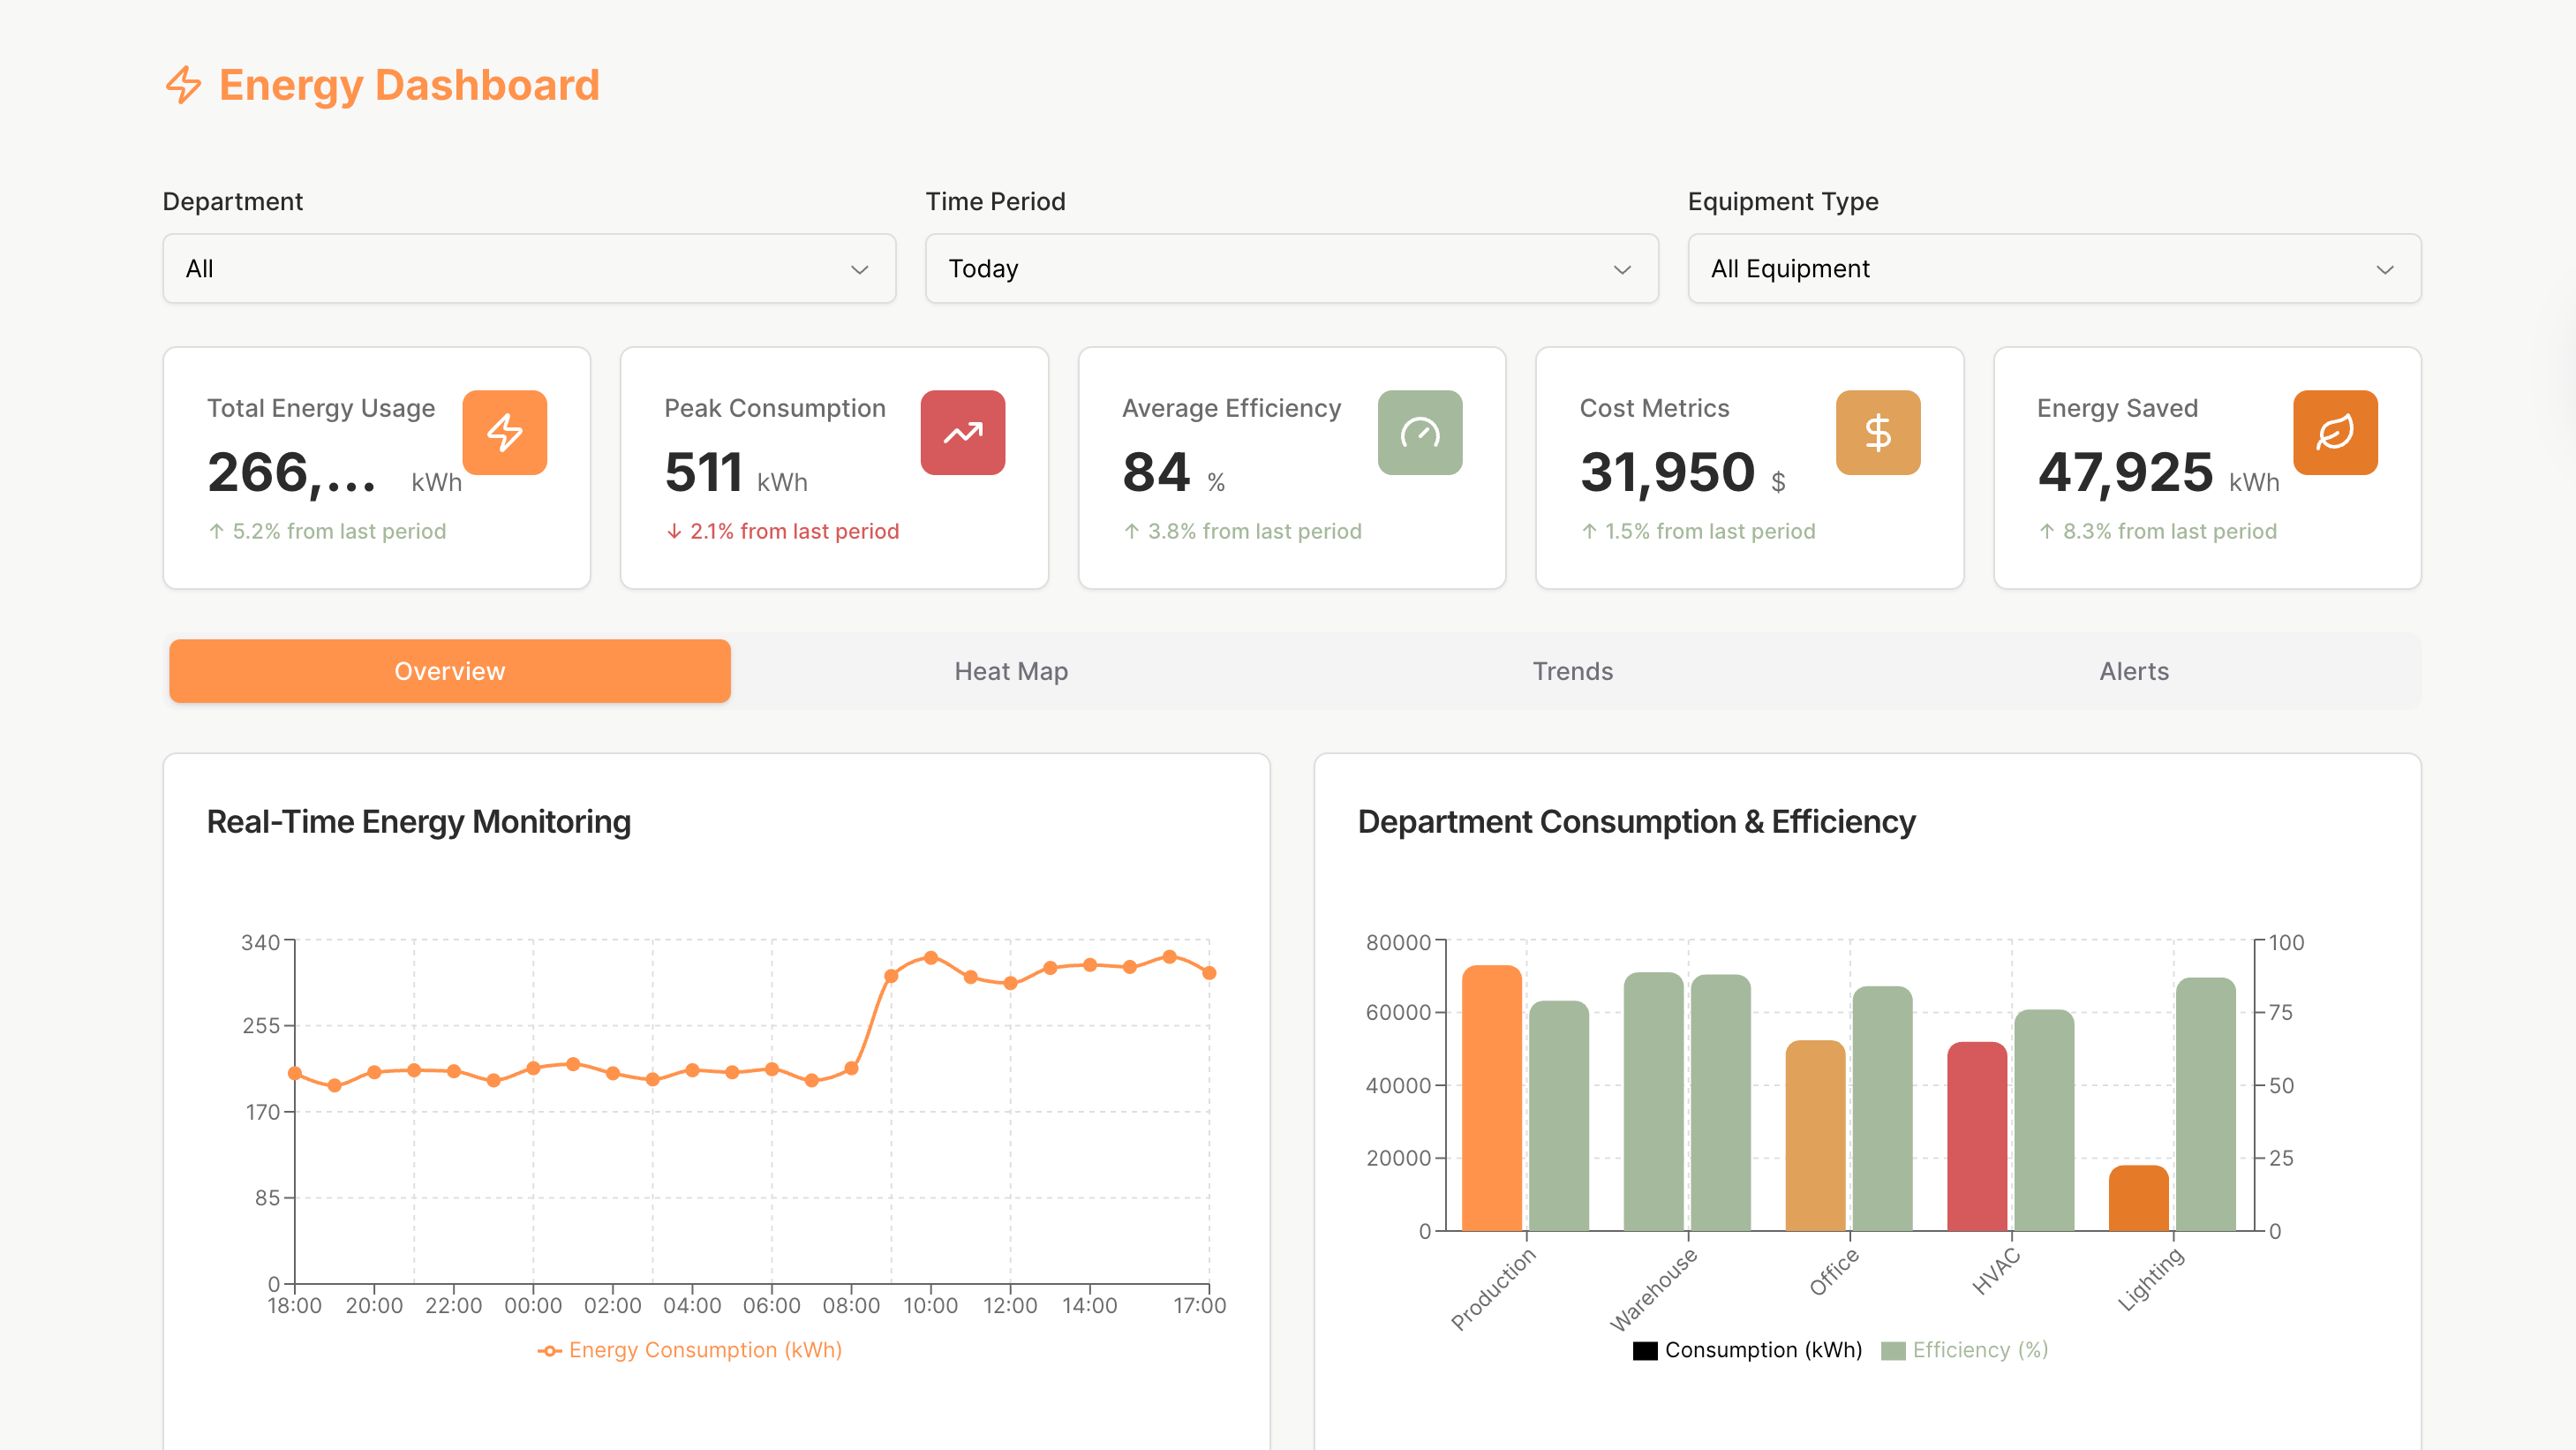
The Energy Dashboard helps engineers, facility managers, and operational stakeholders monitor energy usage, track efficiency, and identify cost-saving opportunities in real time.
It centralizes critical consumption data, reveals high–impact trends, and supports proactive decision-making through interactive charts, heat maps, alerts, and automated reporting tools.
Key Features
Energy Monitoring & KPI Tracking
Monitor total usage, peak consumption, efficiency levels, cost metrics, and energy saved through clear KPI cards that provide immediate insight into overall performance.
Interactive Charts & Real-Time Visualization
Explore real-time energy activity through dynamic line charts, bar graphs, and system-level comparisons. Clickable segments allow users to focus on specific departments, equipment types, or time periods.
Heat Map Insights & Zone-Level Breakdown
Analyze consumption patterns with an interactive energy heat map that reveals hotspots and efficiency gaps. Hover to view detailed metrics and click to instantly filter the dashboard.
Trend Analysis & Anomaly Detection
Track long-term usage patterns with daily, weekly, monthly, or yearly views. Red markers highlight unusual activity, helping teams quickly investigate and resolve potential issues.
Alerts Management & Reporting Tools
Receive detailed alerts for threshold breaches and review recommended actions. Access automated report panels that summarize key findings, highlight efficiency gains, and provide data-driven guidance.
Use Cases
- Energy performance dashboards for industrial facilities
- Building efficiency monitoring for corporate campuses
- Utility consumption tracking for engineering teams
- Cost-reduction and sustainability analytics for operations
- Real-time energy oversight for facility managers
Start Building Your Own Energy Dashboard
Use this Energy Dashboard template to create an intuitive, data-driven energy monitoring system. Connect real energy sources, track consumption, detect anomalies, and generate automated reports using UI Bakery’s flexible low-code platform.
How Energy Dashboard template works?
UI Bakery enables you to transform your data into dynamic internal tools, leveraging a combination of pre-built and customized components.
- To initiate, click "Sign up".
- Establish your organization and create app "From template"
- Customize your generated application visually by intuitively dragging and dropping components and crafting queries for your resources.
- Expand the capabilities of this application by linking to your personal database, kickstarting the development of robust internal tools.
Related Energy Dashboard templates


Related Energy Dashboard templates

"The UI Bakery platform offers a cost-effective approach to creating applications. With UI Bakery, you can achieve your app development goals without breaking the bank."
