BigQuery Dashboard


Overview of BigQuery Dashboard
Harness the power of Google BigQuery with the help of the BigQuery Dashboard. Designed within UI Bakery, this dashboard ensures data engineers, analysts, and IT professionals can smoothly interact with their data.
Highlights of BigQuery Dashboard
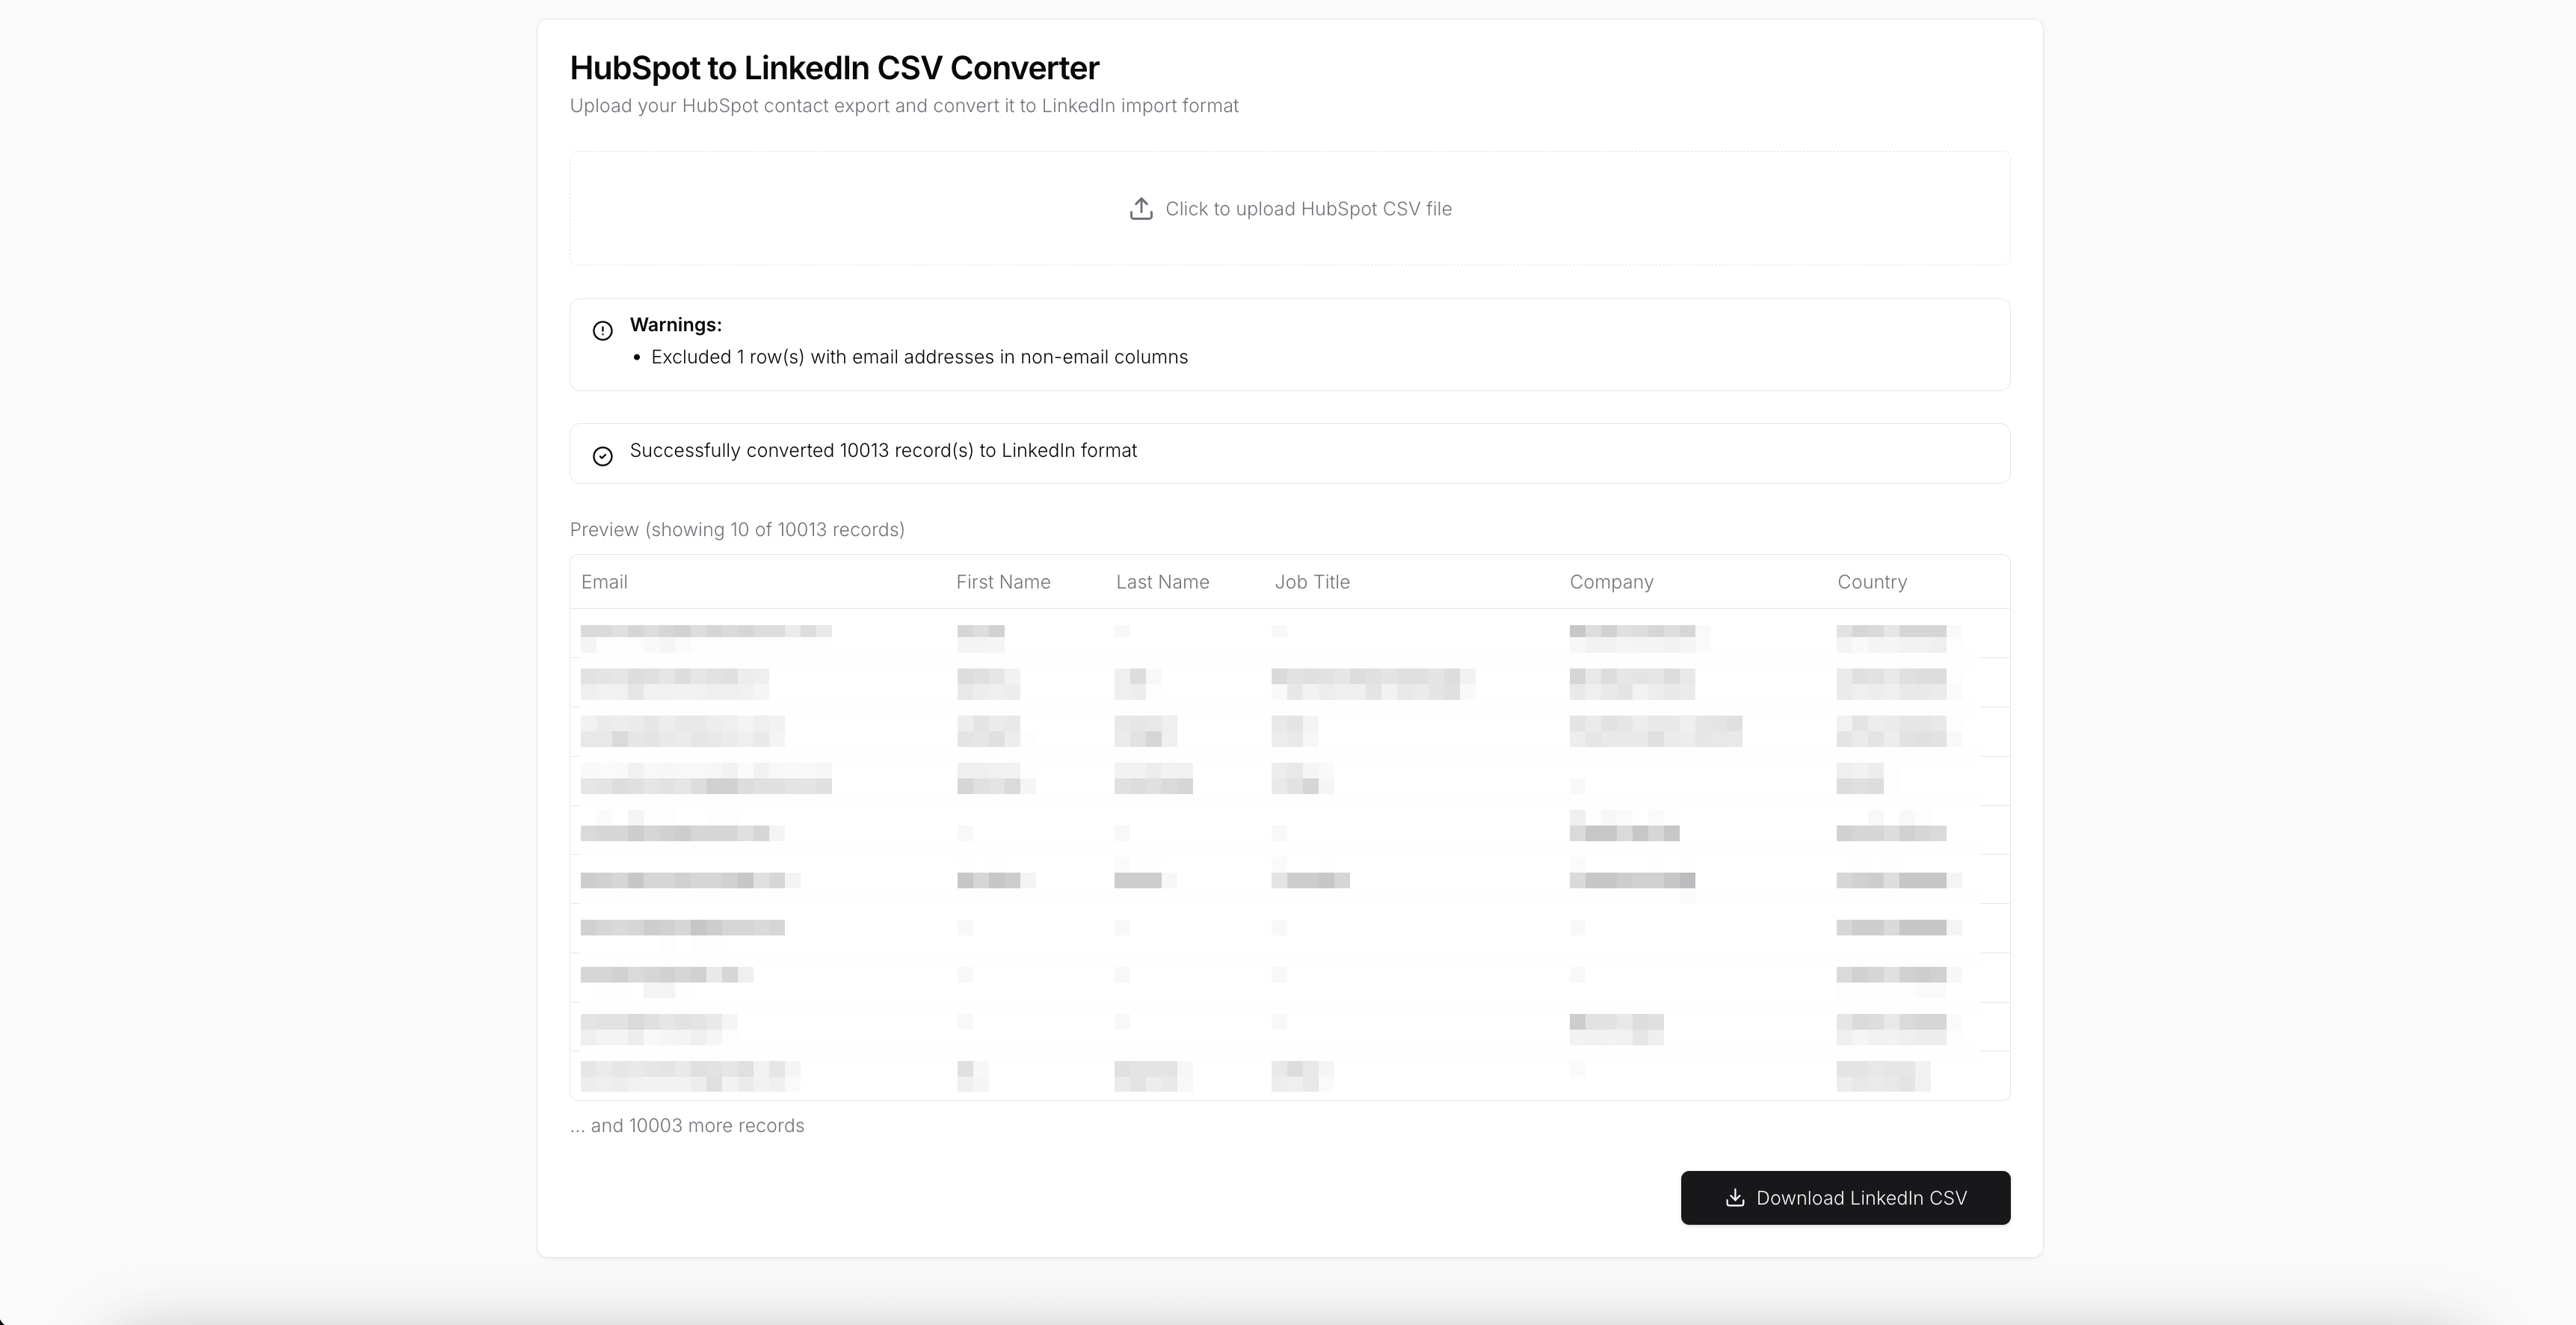
- Advanced Query Execution - Efficient Data Retrieval: Use the built-in editor to write complex SQL queries with ease and retrieve the data you need.
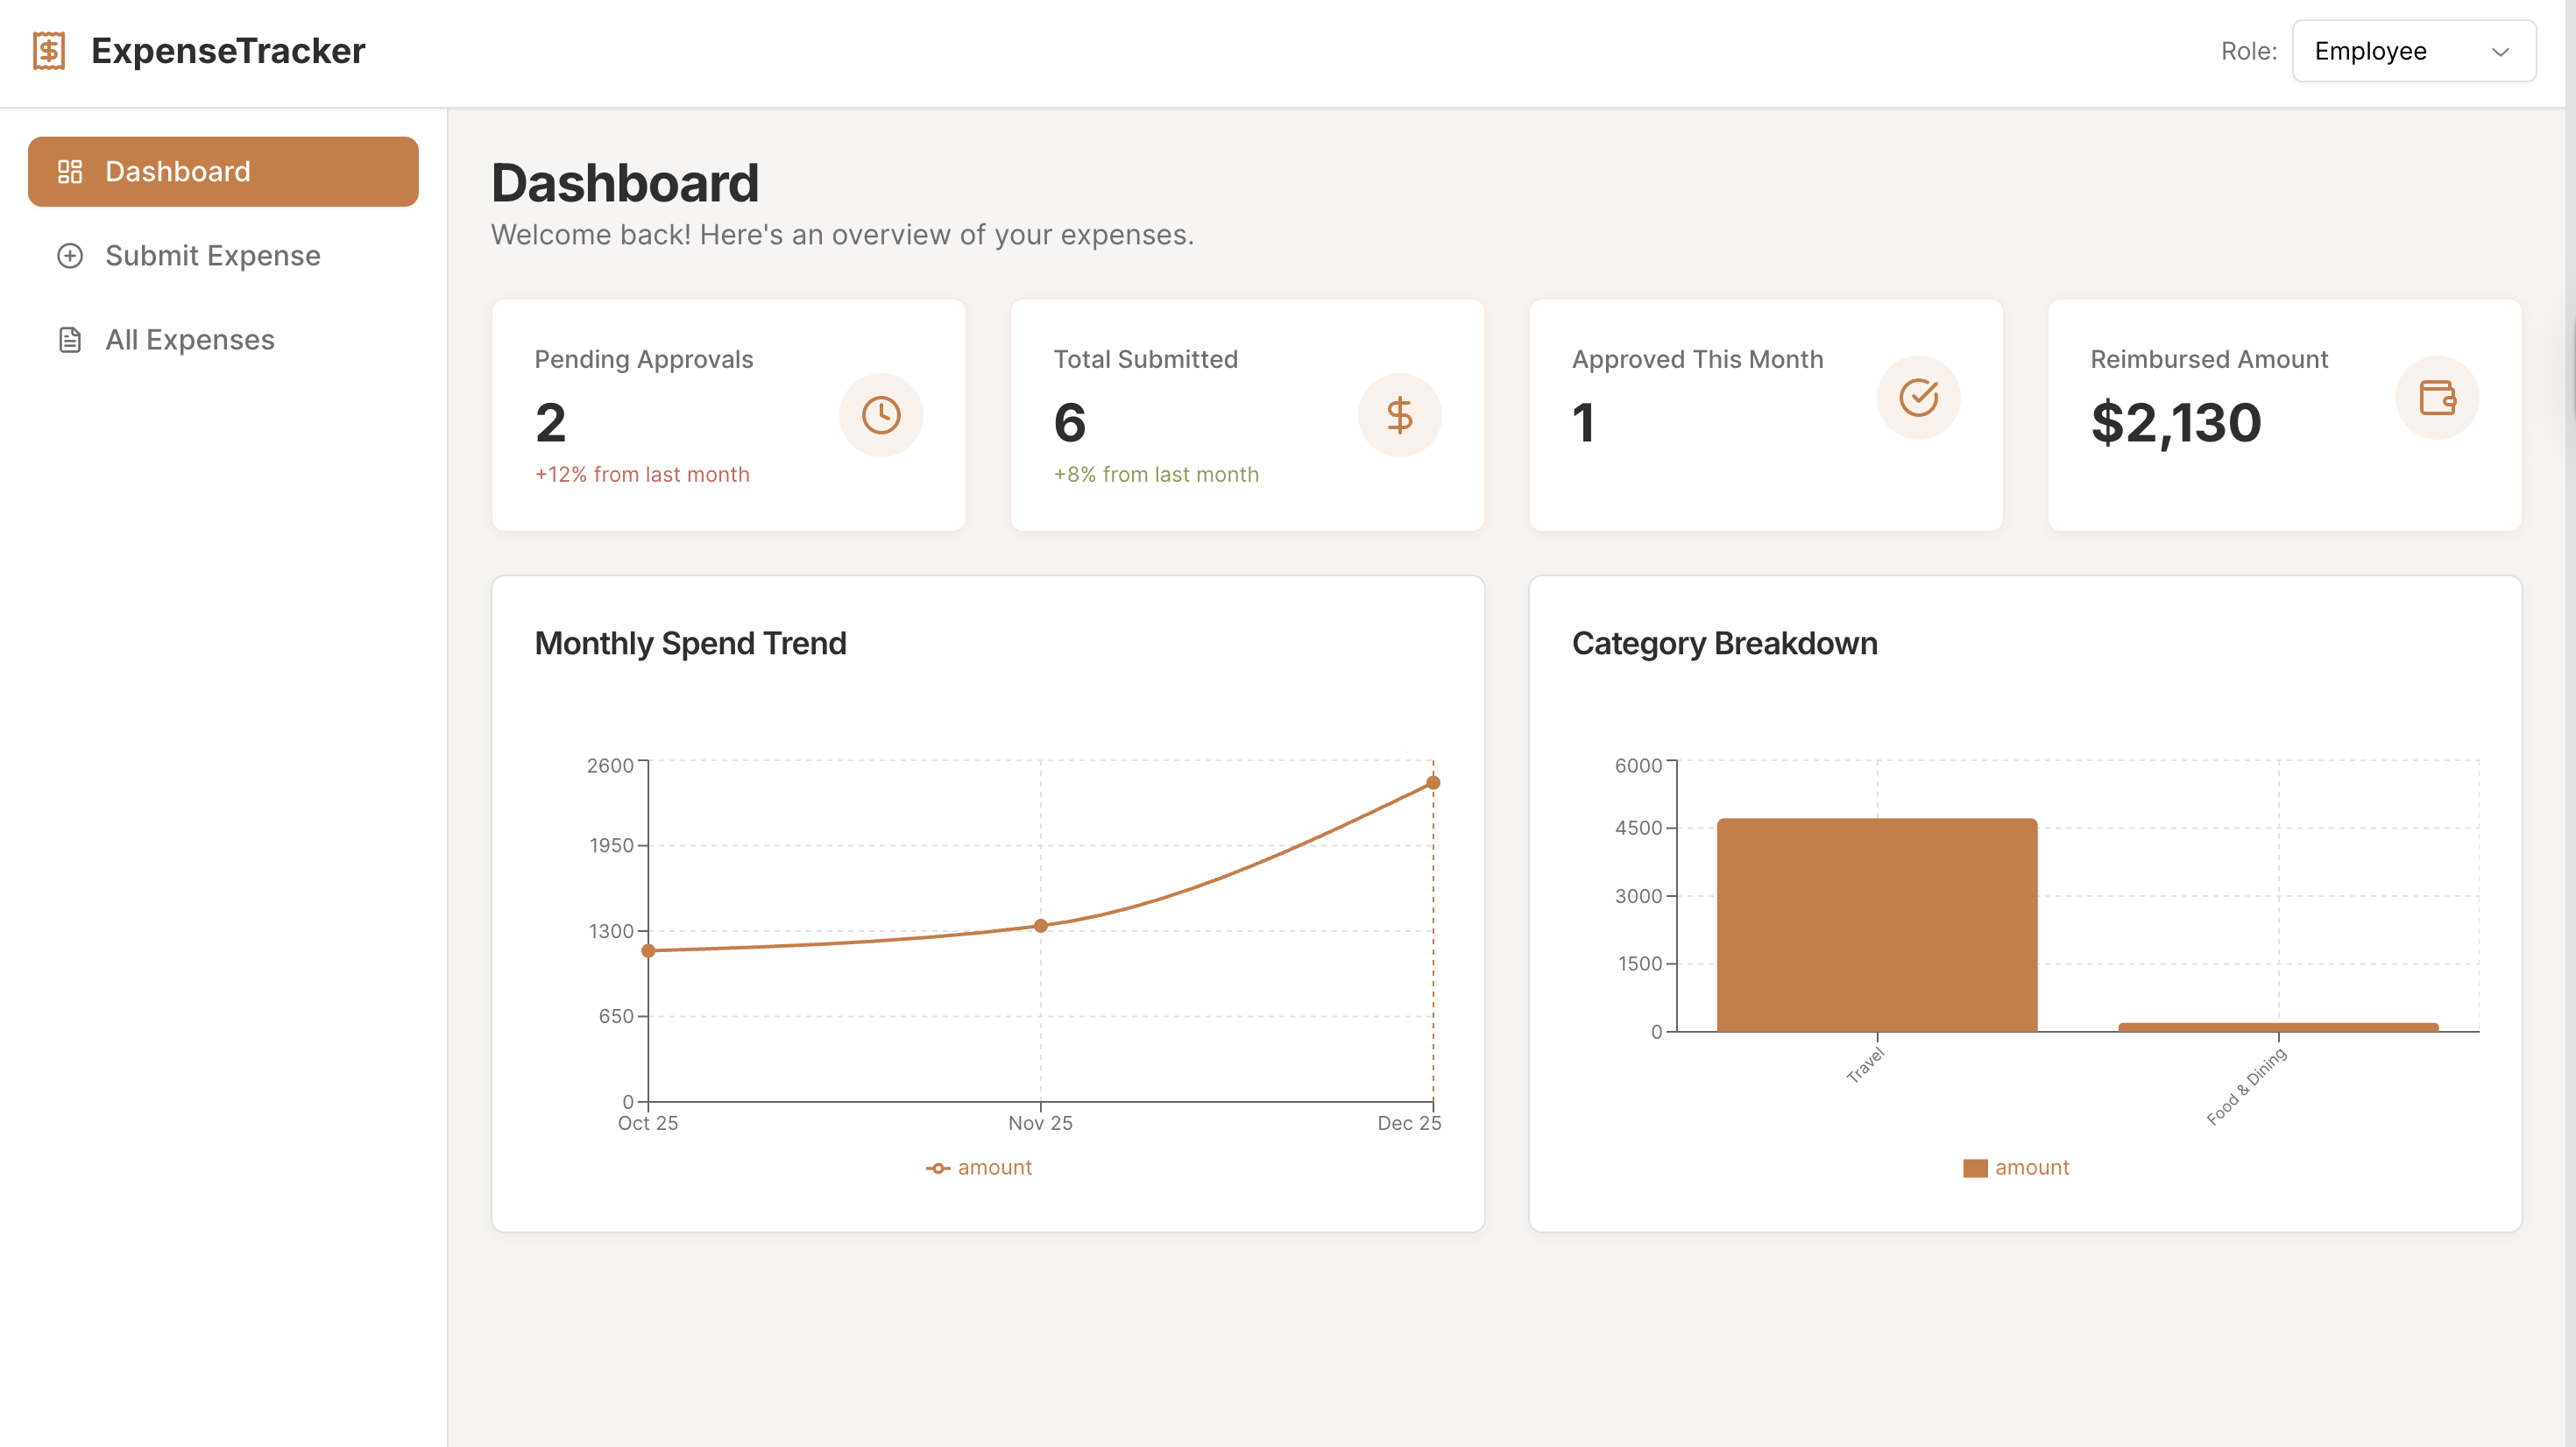
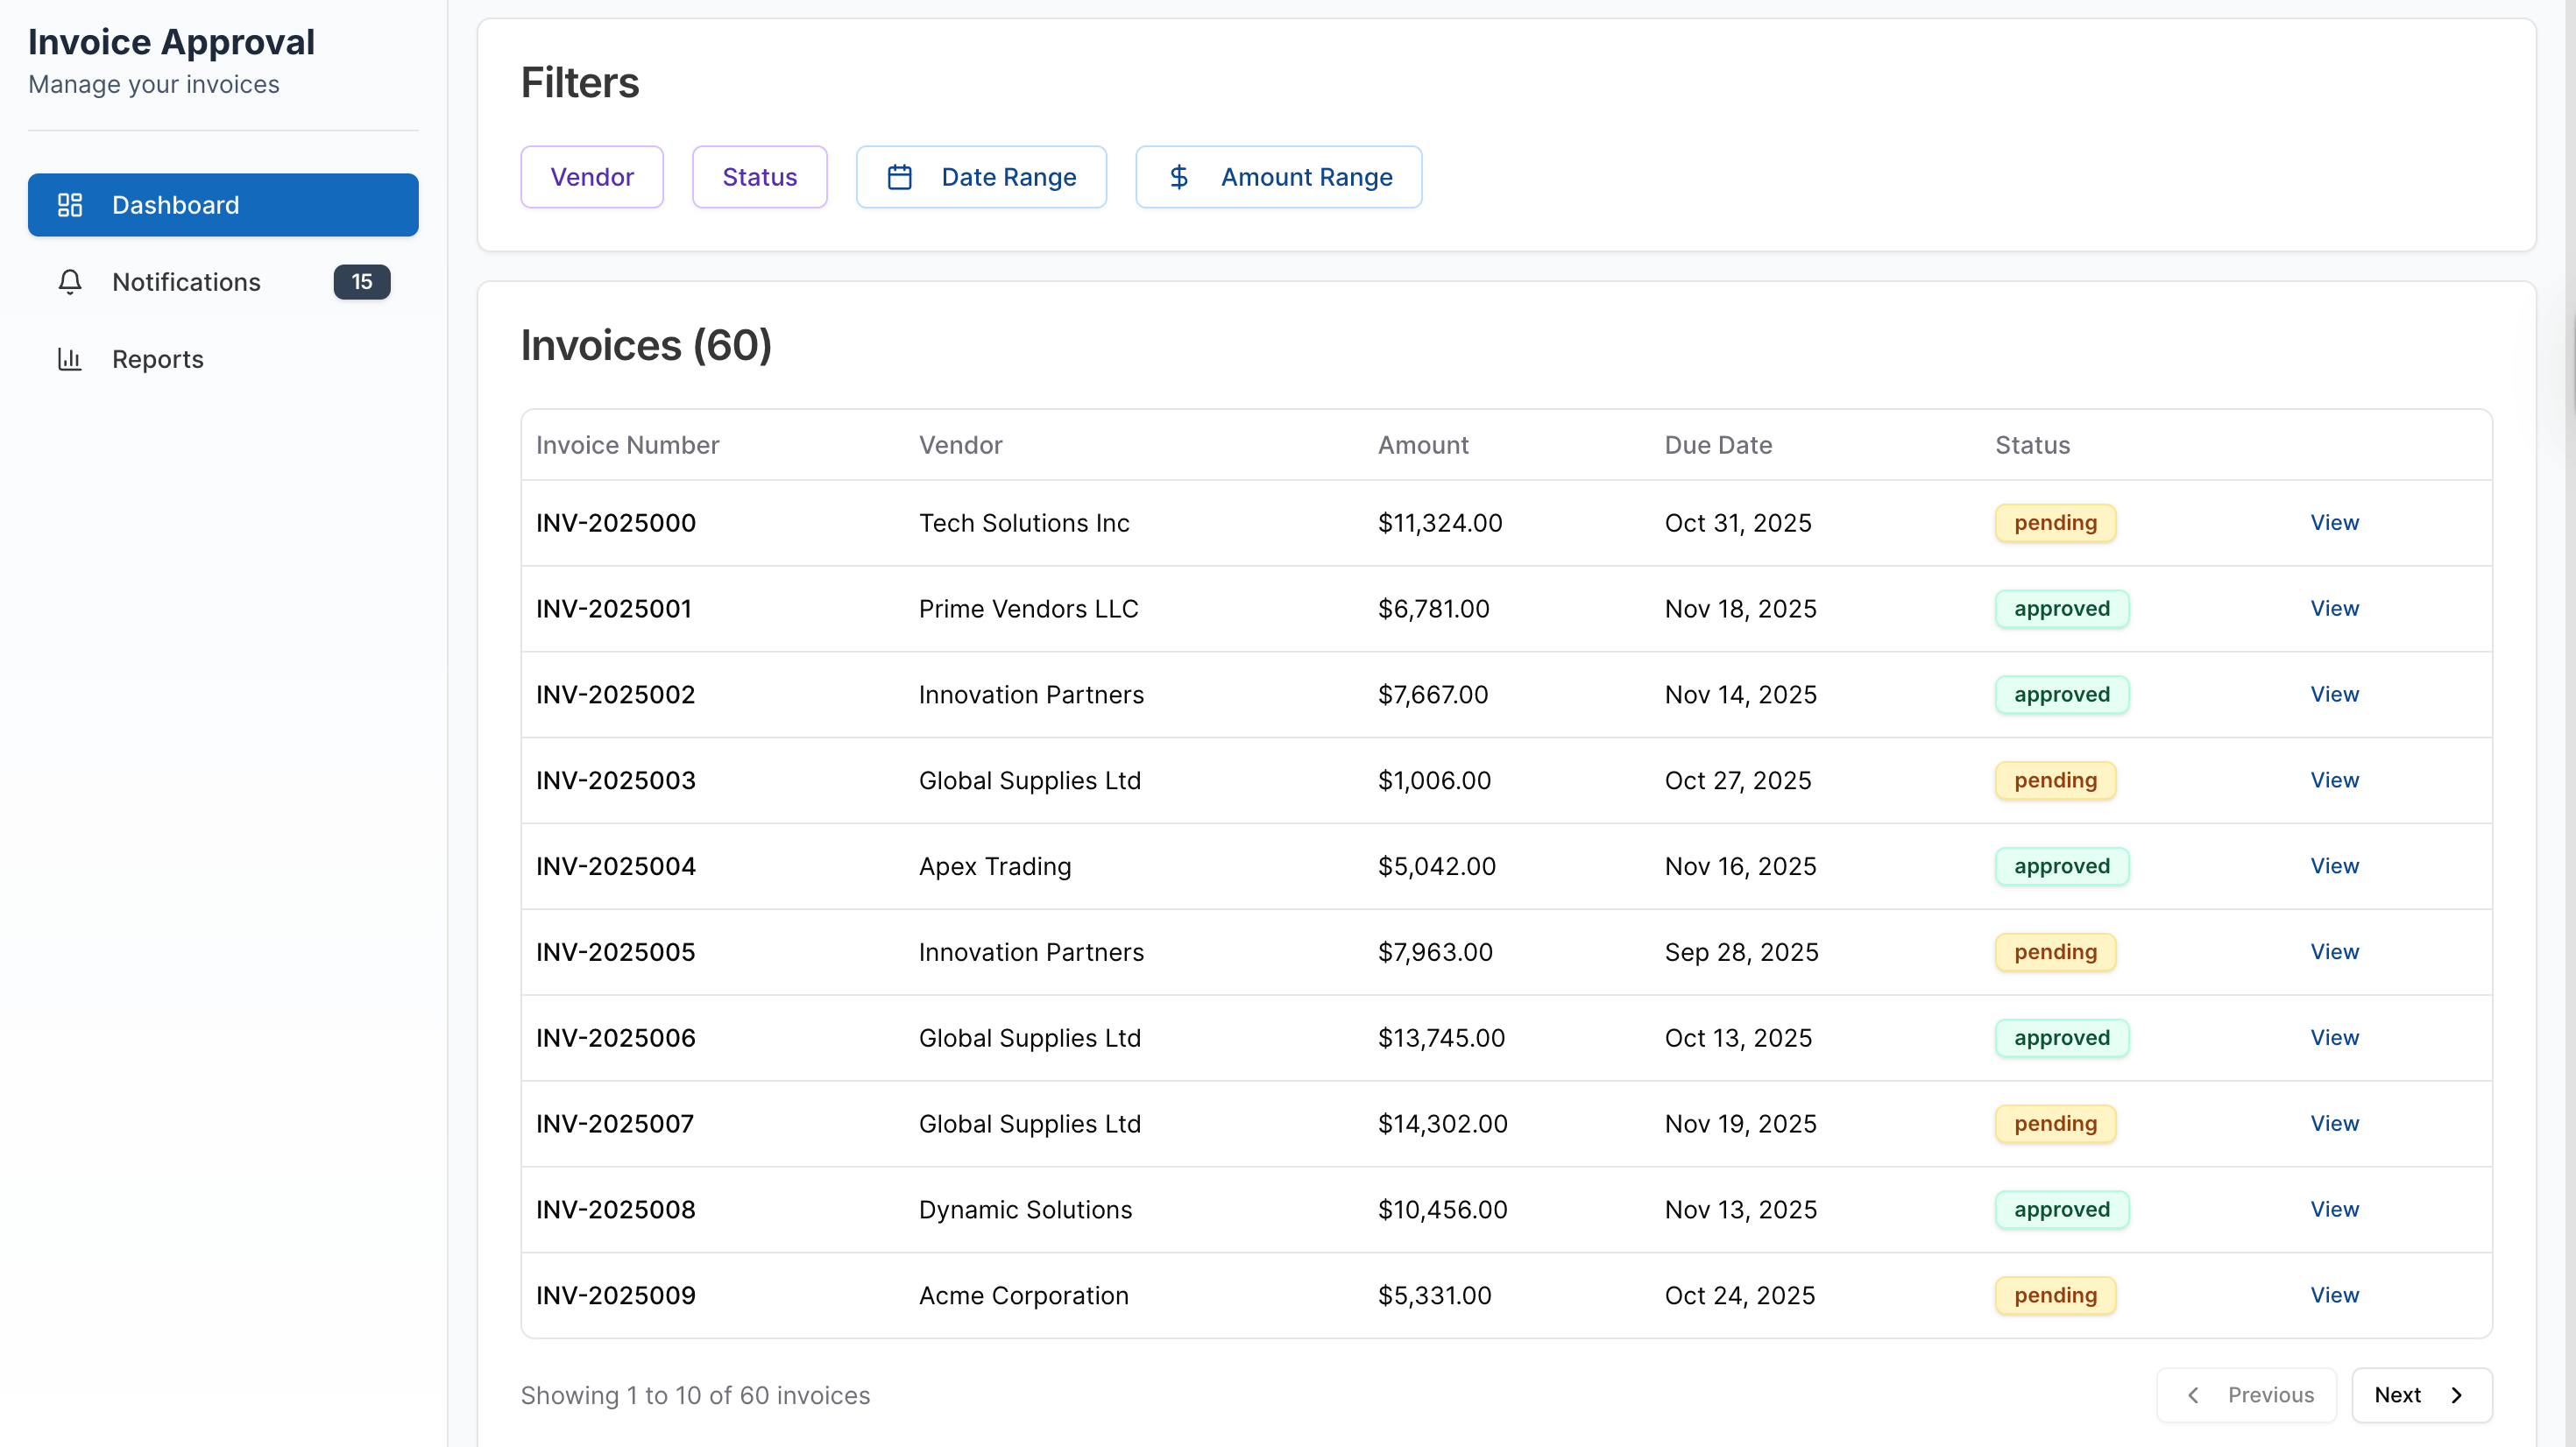
- Comprehensive Result Screens - Crystal Clear Data Representation: Results from your queries are dynamically displayed in a structured view, geared towards easy data comprehension.
- Multiple Visualization Options - Personalized Data Analytics: Choose from a range of chart types to visualize your data precisely how you want, enabling better decision making.
- Easy Data Export - Convenient Data Management: Export the data and analysis results in different formats for further processing or reporting, empowering your data workflow to be more efficient.
Template integrations:
Template Solutions:
How BigQuery Dashboard template works?
UI Bakery enables you to transform your data into dynamic internal tools, leveraging a combination of pre-built and customized components.
Try UI Bakery
- To initiate, click "Sign up".
- Establish your organization and create app "From template"
- Customize your generated application visually by intuitively dragging and dropping components and crafting queries for your resources.
- Expand the capabilities of this application by linking to your personal database, kickstarting the development of robust internal tools.
Related BigQuery Dashboard templates


Related BigQuery Dashboard templates

"The UI Bakery platform offers a cost-effective approach to creating applications. With UI Bakery, you can achieve your app development goals without breaking the bank."

"Before switching to UI Bakery we developed a number of apps within the Retool system. The Retool system was good but ultimately did not have the flexibility and feature sets that we required."
Check the Story