5 best Excel dashboard tools to opt for in 2025

Updated:
June 20, 2024
As the need for real-time access to visually appealing and synchronized data data-driven decision-making continues to grow, Excel dashboard tools have become increasingly essential for businesses and individuals alike. These tools enhance the capabilities of Excel by providing robust data visualization, automation, and reporting features. Here are five of the best Excel dashboard tools to consider in 2024-2025, along with their features, pricing, pros, and cons.
UI Bakery
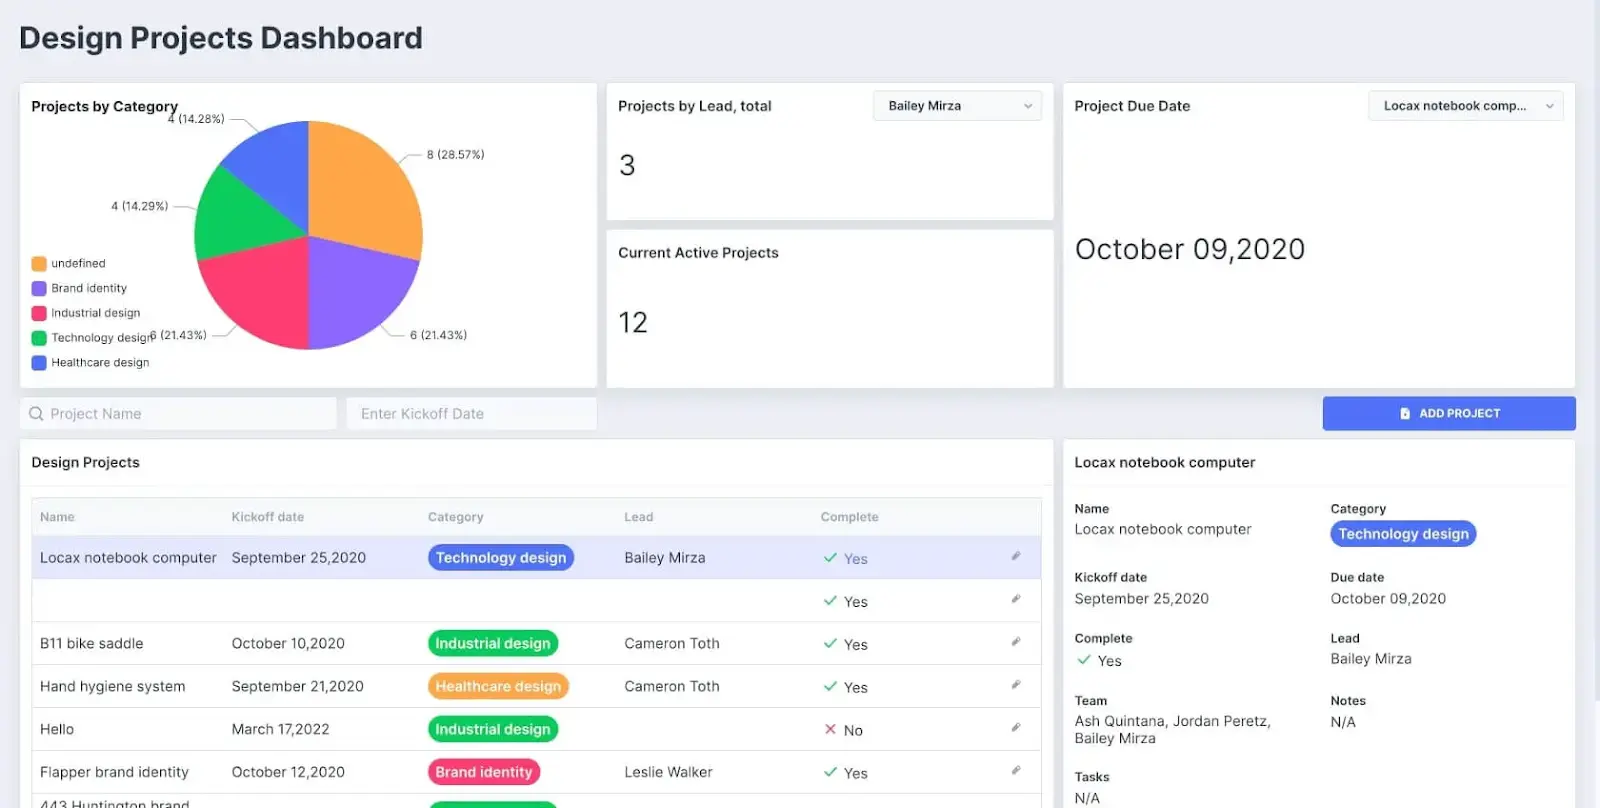
UI Bakery is a low-code platform that helps enhance the user interface and experience of Excel dashboards. With advanced features that help developers create visually appealing and interactive dashboards, UI Bakery makes data visualization and reporting more efficient and simple.
You may want to start with one of the pre-made templates – UI Bakery for Excel dashboards, offering a rich feature set described below.
Key features:
- Offers a wide range of customization options, like widgets, buttons, sliders, and checkboxes.
- Advanced charting capabilities beyond Excel's native options, providing more complex and informative data presentations.
- Dynamic filtering options for real-time insights without constantly refreshing the entire dashboard.
- Drag-and-drop interface that streamlines and simplifies the dashboard creation.
- Supports integration with various data sources, making it easier to consolidate data from multiple locations.
- Ensures that dashboards are responsive and can be viewed on different devices without losing functionality or clarity.
Pricing: has a free trial. The pricing plan starts from €4 per month per user when billed annually.
Pros:
- Enhanced Excel capabilities within one tool.
- Rich template library to choose from.
- Customization for dashboards to fit business needs.
- User-friendly and low-code platform for anyone without technical knowledge.
- Vast integration list for multiple data sources to be seamlessly connected.
Cons:
- There might be a learning curve for users unfamiliar with advanced Excel functions or dashboard tools.
- The tool might be pricey for small businesses opting for the higher-tier plans.
Power BI
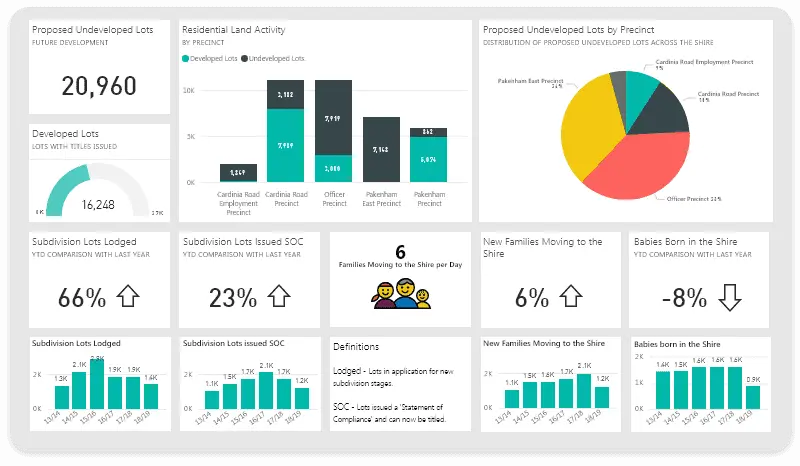
As a data visualization and reporting platform, Microsoft Power BI is specifically designed to be as easy to use and understand for those without any specialized data knowledge.
Key features:
- Interactive dashboards to build visually appealing and interactive dashboards.
- Data integration is used to extract information from various sources, like Excel, SQL Server, and cloud services, to name a few.
- Advanced analytics with AI-powered insights and custom visuals for reporting.
- Collaboration to securely and effortlessly share data with the team and collaborate in real-time.
Pricing: has a free trial. The pricing plan starts from $9.99 per user per month.
Pros:
- Seamless integration with assistant tools like Excel and other Microsoft products
- Advanced analytics
- Robust sharing and collaboration features
Cons:
- Requires learning for it to be used
- Premium pricing options can be expensive for small teams
Tableau
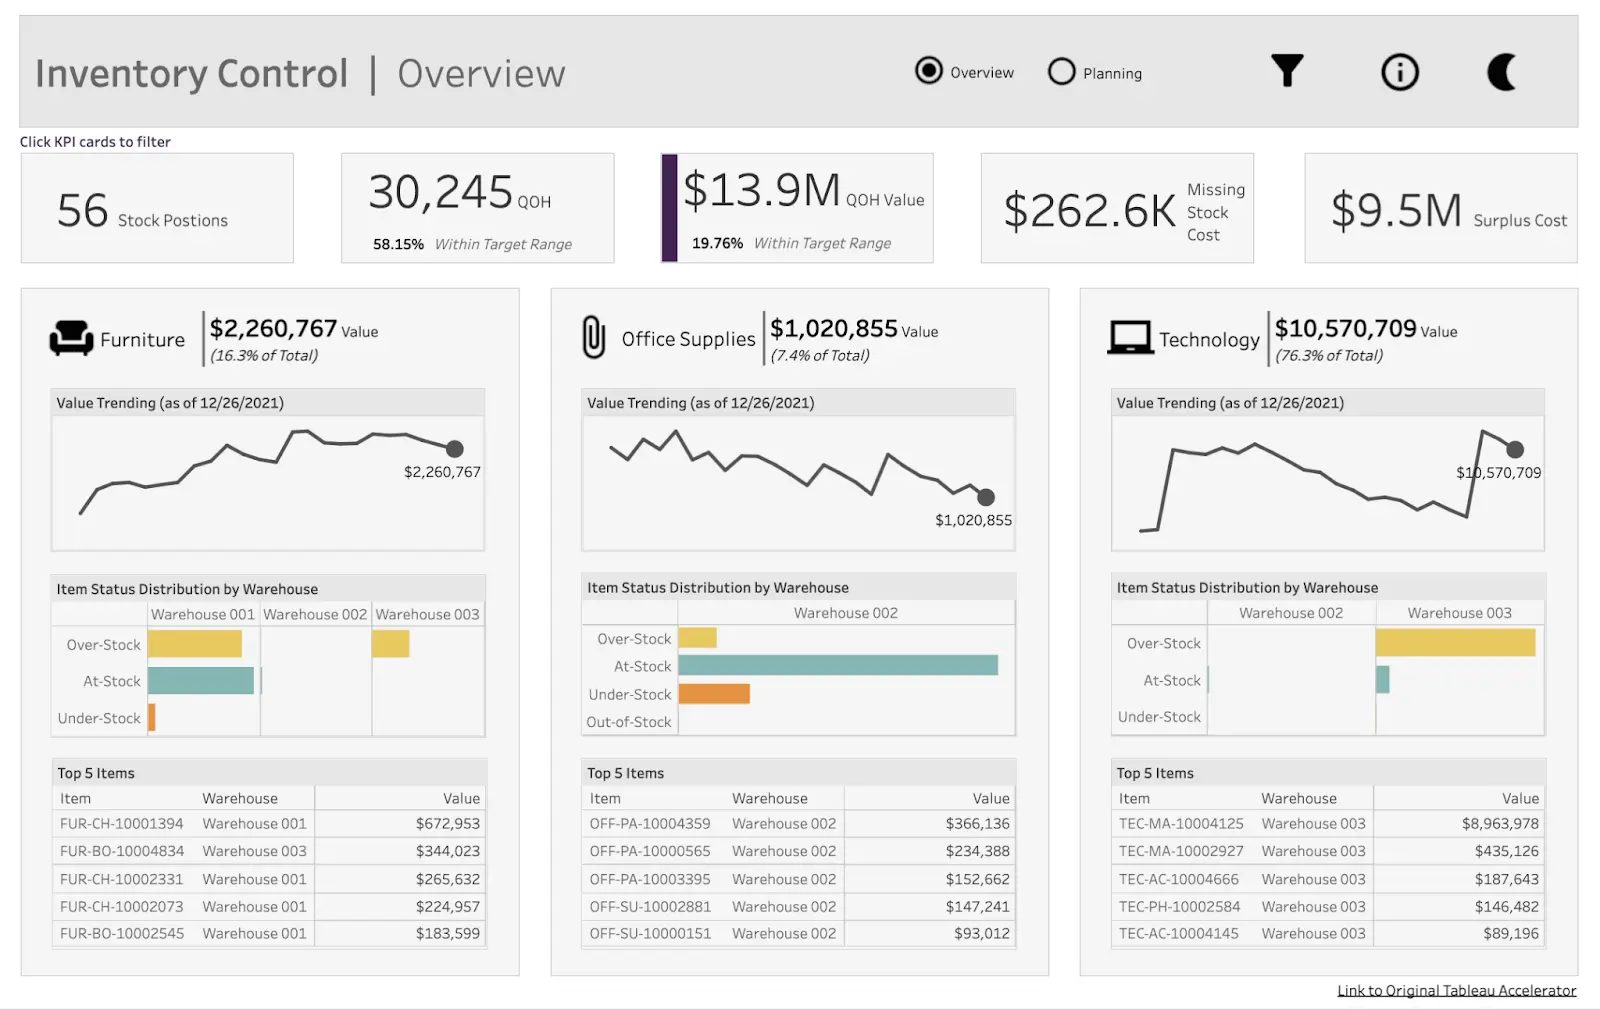
Tableau offers everything teams may need to access, visualize, and analyze their data. With its intuitive drag-and-drop interface, users can easily create charts and visualizations collecting information from a variety of data sources.
Key features:
- Drag-and-drop functionality for creating interactive dashboards
- Integration options to extract information from various data sources
- Real-time data updates and live advanced analytics.
Pricing: plans start from $15 per user/month.
Pros:
- Mobile friendly
- Rich documentation
- Ability to quickly create interactive visualizations
Cons:
- High cost when compared to similar tools
- No automatic refreshing and reports
Zoho Analytics
As a powerful business tool used by broad organizations to analyze vital data and create informative dashboards, Zoho also offers a simple-to-use assistant powered by technologies like machine learning (ML), artificial intelligence (AI), and language processing technologies (NLP).
Key features:
- Customization for dashboards to tailor business needs.
- It integrates multiple data sources like databases, Excel, and cloud services.
- Automated insights are offered by tools like Zia and Zoho AI's assistant.
Pricing: has a free trial with limited features. The pricing plan starts from $24 per month for 2 users per month.
Pros:
- Affordable
- Strong AI-driven insights
Cons:
- Limited analytics functionality when compared to competitors.
- May have poor performance when working with large datasets.
Sisense
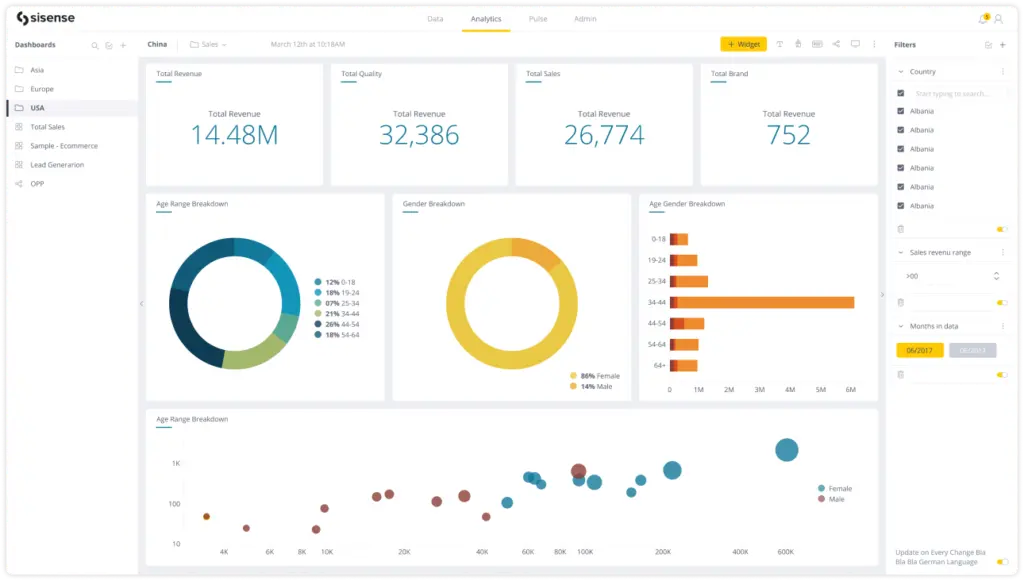
As a flexible developer toolkit, Sisense can easily be integrated with Excel to analyze, picture and share data in a code-first, scalable, modular way. Known for its rich feature set and ability to operate with complex data sets, making it an ideal option for those working with large data volumes.
Key features:
- Embedded dashboards and analytics into apps.
- Integrates with various data sources like Excel and cloud services.
- Advanced analytics and data-driven insights powered by AI and Machine Learning.
- Customization of dashboards.
Pricing: pricing is custom and based on business requirements.
Pros:
- Robust and advanced analytics capabilities.
- Scalable and flexible deployment options.
- Customization options.
Cons:
- Custom pricing might be a red flag for small teams.
- Usually, it requires technical expertise to use advanced features.
The bottom line
Choosing the right Excel dashboard tool will depend on several factors, including your specific needs, budget, and technical expertise your team has. UI Bakery and Power BI are perfect options for advanced analytics and data visualization, while Zoho Analytics is simpler in functionality and more affordable.


"The UI Bakery platform offers a cost-effective approach to creating applications. With UI Bakery, you can achieve your app development goals without breaking the bank."

"Before switching to UI Bakery we developed a number of apps within the Retool system. The Retool system was good but ultimately did not have the flexibility and feature sets that we required."
Check the Story