
Turning BigQuery Data into Operational Internal Tools
.png)
Updated:
March 17, 2026
BigQuery is often introduced into growing product companies as the analytical backbone of the data stack. Usage telemetry, subscription exports, experiment assignments, and lifecycle signals gradually converge into structured warehouse tables. Over time, this creates a reliable environment for measuring engagement trends, tracking monetization performance, and evaluating product changes.
The challenge begins when teams need to move from observing metrics to understanding individual situations. A dashboard can show that feature adoption is declining, but it rarely explains which accounts are affected, what changed in their behavior, or what action should follow. Product managers and growth teams often end up requesting ad-hoc SQL queries or exporting datasets into spreadsheets just to investigate a single segment.
To close this gap, some organizations introduce an internal application layer on top of their BigQuery datasets. Instead of treating warehouse tables purely as reporting sources, they become the foundation for operational investigation tools that help teams respond to product signals faster.
Investigating Feature Adoption Drops in Practice
Consider a product-led SaaS company that streams application events into BigQuery through ingestion pipelines. Transformation jobs produce curated analytical tables capturing weekly feature usage, account health indicators, subscription performance, and experimentation cohorts. Leadership monitors overall engagement through BI dashboards, but when adoption of a newly released feature begins to drop, the product team needs a more direct way to explore what is happening.
An internal product analytics workspace can provide this visibility. The entry screen presents a structured overview of feature performance across the customer base. Key indicators such as weekly active accounts, overall adoption percentage, declining usage segments, and high-risk accounts are calculated directly from warehouse rollups. Trend charts make it easier to understand whether adoption changes are gradual or sudden, while distribution views help teams identify differences across subscription plans.
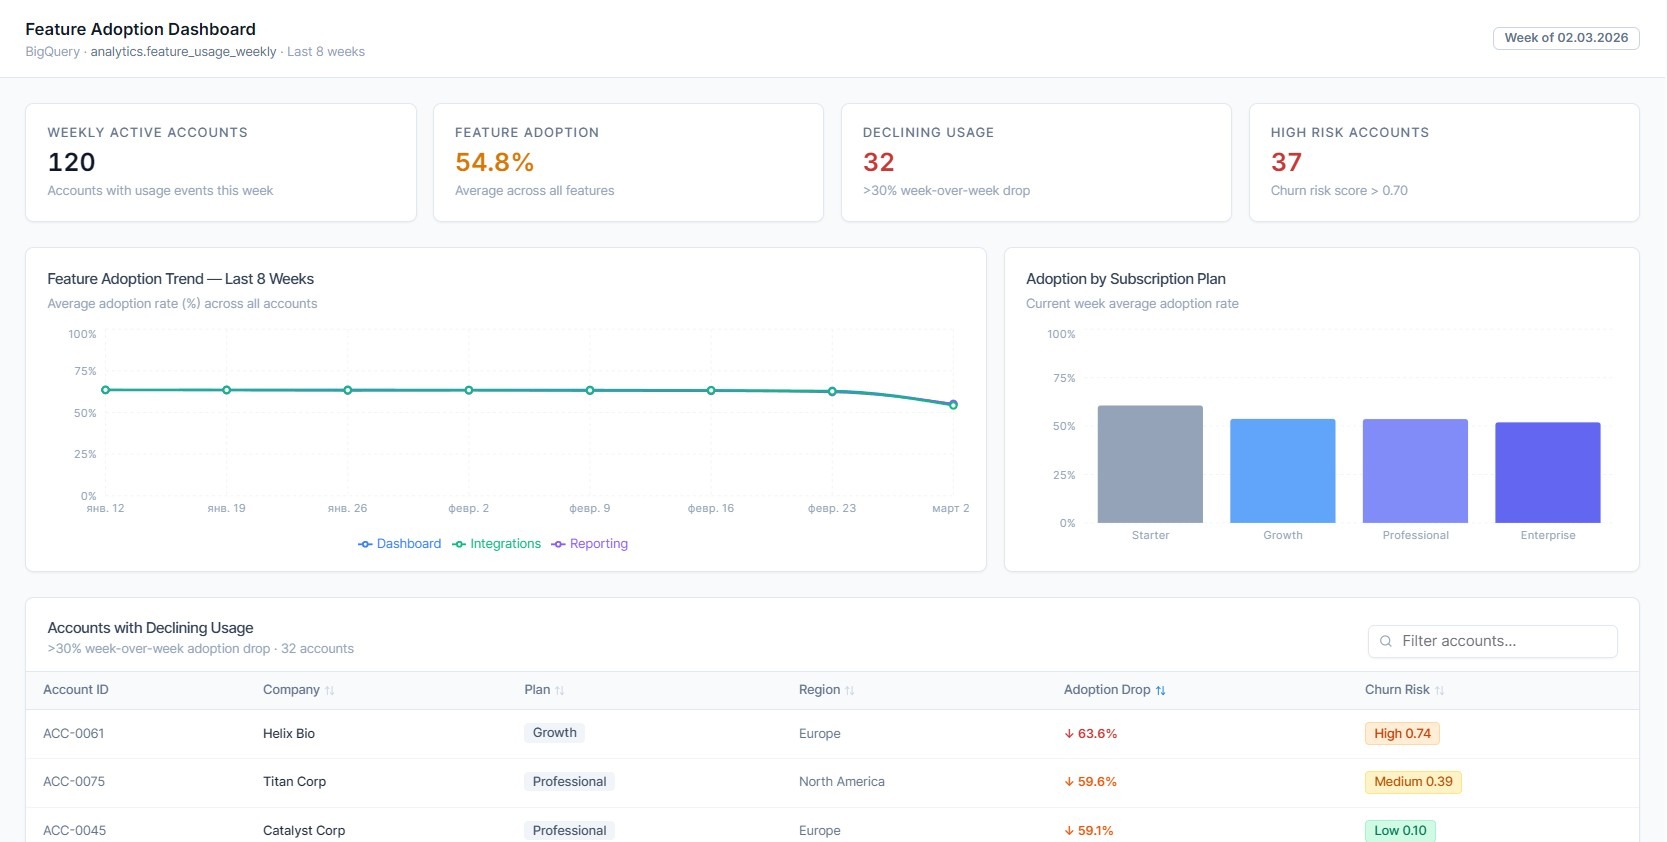
This overview gives product teams immediate context before they begin deeper investigation. Instead of switching between multiple analytics tools, they can move directly from summary signals to account-level exploration.
From Signals to Account-Level Investigation
Below the summary metrics, the application highlights accounts experiencing significant week-over-week adoption decline. Interactive filtering allows product managers to isolate segments based on region, subscription tier, or engagement thresholds without writing SQL queries manually.
Selecting an account opens a detailed investigation workspace that combines multiple warehouse datasets into a coherent operational view. The account summary panel provides essential business context such as subscription plan, monthly recurring revenue, renewal timeline, and churn risk score. This allows teams to quickly understand the commercial importance of the affected account.
A weekly feature usage chart visualizes how engagement evolved over recent release cycles. Event timelines retrieved from BigQuery joins help reveal whether adoption dropped after onboarding changes, pricing updates, or experiment assignments. This level of detail helps product teams distinguish between expected behavioral variation and genuine usability problems.
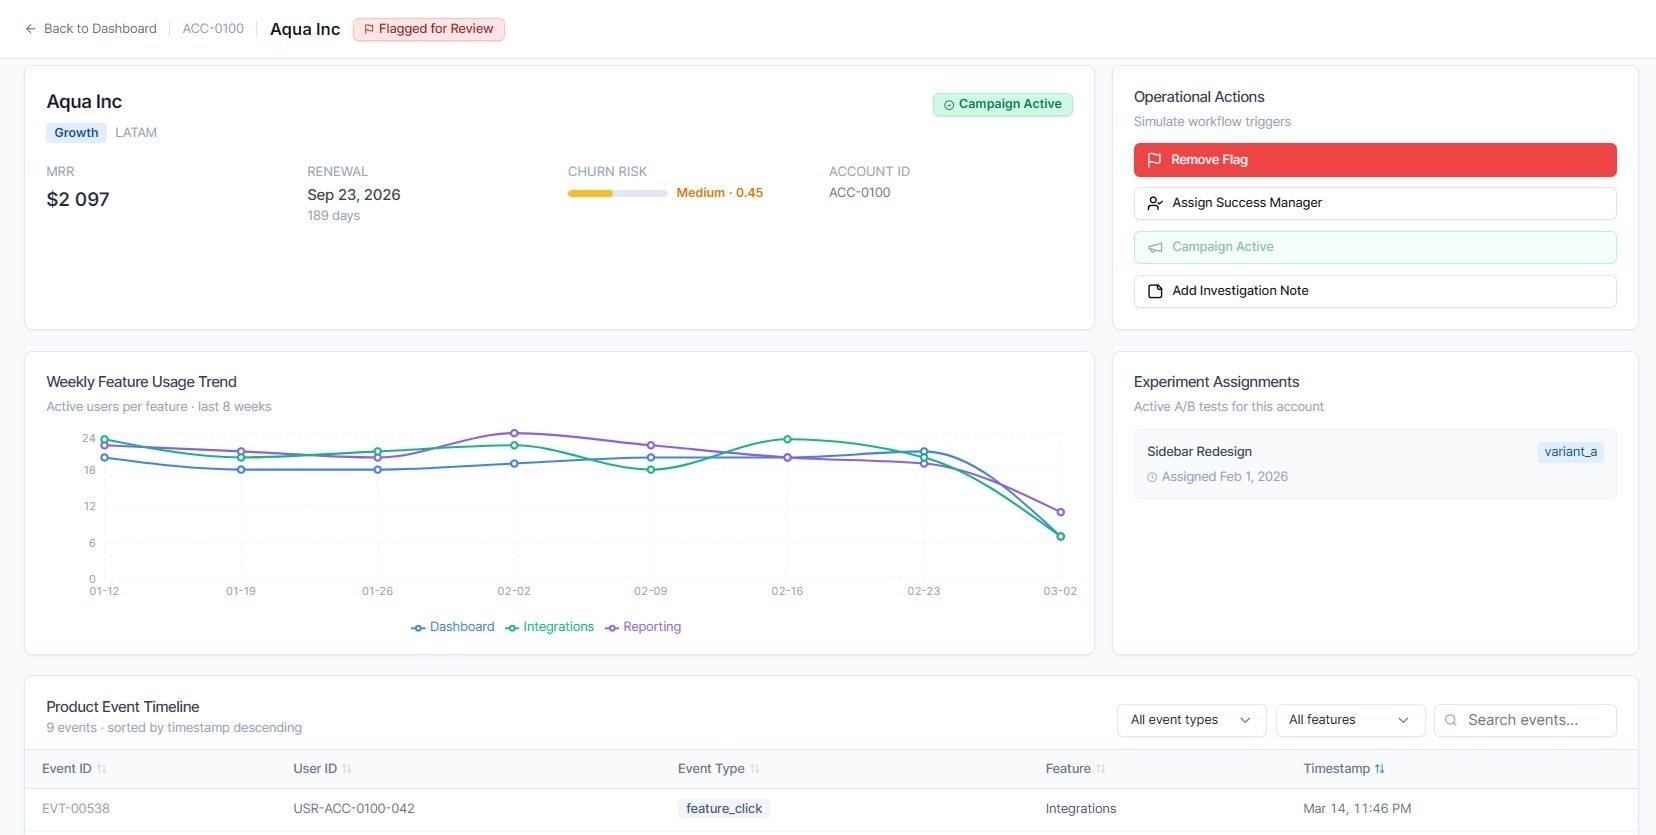
Because the interface reads directly from analytical tables, the data reflects recent product interactions without requiring additional synchronization layers.
Supporting Operational Actions in the Same Workspace
Investigation alone is rarely enough. Once an adoption issue is identified, teams typically need to coordinate follow-up actions. An internal application can provide workflow controls directly within the analytical context. For example, product or growth teams can flag accounts for review, assign ownership to a success manager, or trigger re-engagement campaigns through integrated operational systems.
Notes added during investigation help preserve decision context and reduce duplicated effort across teams. These workflow interactions update operational tools such as CRM or marketing automation platforms while BigQuery continues to serve as the analytical backbone rather than a transactional database.
Designing Applications That Query BigQuery Efficiently
Using a warehouse as a live data source for internal tools requires careful engineering considerations. Investigation workflows often involve repeated filtering on large event tables, which makes partition pruning and clustering strategies important for predictable query performance.
Many teams introduce pre-aggregated weekly rollups or materialized views to reduce scan volumes for dashboard metrics. Pagination patterns and bounded result retrieval help maintain responsive interfaces when users explore large account segments. In some architectures, caching layers are added to store frequently accessed account-level summaries, improving perceived performance without duplicating analytical datasets.
These optimizations allow organizations to combine warehouse-scale analytical computation with practical operational interfaces.
Extending the Pattern Beyond Product Teams
Once a product analytics investigation workspace is in place, similar internal applications can be introduced across other operational domains. Growth teams may build campaign monitoring tools based on attribution datasets stored in BigQuery. Customer success teams can track onboarding progress and renewal readiness using shared warehouse models. Finance departments can develop reconciliation interfaces that transform transaction exports into structured validation workflows.
Because these tools rely on centralized analytical tables, organizations avoid creating parallel reporting silos while still improving day-to-day decision efficiency.
Bringing Analytical Infrastructure Closer to Product Execution
BigQuery enables companies to process behavioral datasets at scale, but the real value emerges when warehouse insights can be translated into timely operational decisions. Internal applications built on top of analytical tables provide the interaction layer required for investigation, ownership, and action.
Platforms such as UI Bakery make it possible to create these investigation workspaces quickly by combining parameterized BigQuery queries with structured UI components and workflow integrations. For product-driven companies, this architecture helps transform analytics infrastructure into an environment where feature adoption signals can be explored and addressed without delay.


.jpg)

"The UI Bakery platform offers a cost-effective approach to creating applications. With UI Bakery, you can achieve your app development goals without breaking the bank."

"Before switching to UI Bakery we developed a number of apps within the Retool system. The Retool system was good but ultimately did not have the flexibility and feature sets that we required."
Check the Story