How to build an orders tracking internal tool on top of MySQL

Updated:
December 20, 2021
The days when you had to spend weeks or months to develop an orders tracking tool have passed. With the emergence of no-code and low-code development platforms, building a UI is possible simply by drag-and-dropping predefined building blocks. Connecting data sources to the UI doesn’t require much time as well.
We’ll describe today how you can create a dashboard based on MySQL in UI Bakery to add clients, monitor orders, payment details, and visualize various metrics. We’ll cover how to connect MySQL as a data source, pull data from several tables, and visualize your data.
Step 1. Connect a data source
We start with logging into UI Bakery, creating a new app, naming it appropriately, and selecting a blank template. You’ll be moved to the Builder after that.
Once you created an application, you can go to the page with data sources and pick MySQL from the list there. Remember to name your data source, it will be especially helpful if you’re planning to use several data sources within one web app. When entering your database data, specify a host, a port, and credentials. Remember to test your database connection before actually connecting it to your application.
Step 2. Add customization and enable data filtering
Let’s work with Tables now. We need to customize them, add the relevant data, and set filtering.
To add the data on your customers to the Table, you need to create an Action – “Load Table”. Then select a data source (your MySQL database), and pick the “Customers” Table from the list. To check the results, click “Run Action” and go the Result tab below.
In case there are any errors, UI Bakery will highlight them in red so you’d be able to promptly troubleshoot without leaving the Builder. You can further customize the added Table as you need. Using an eye icon, you can hide any data from the Table you don’t need to display.
You’ll most likely need an ability to edit the records right from your Table. To do that, select the Table, go the Appearance tab in the right sidebar, and check “Edit action”.
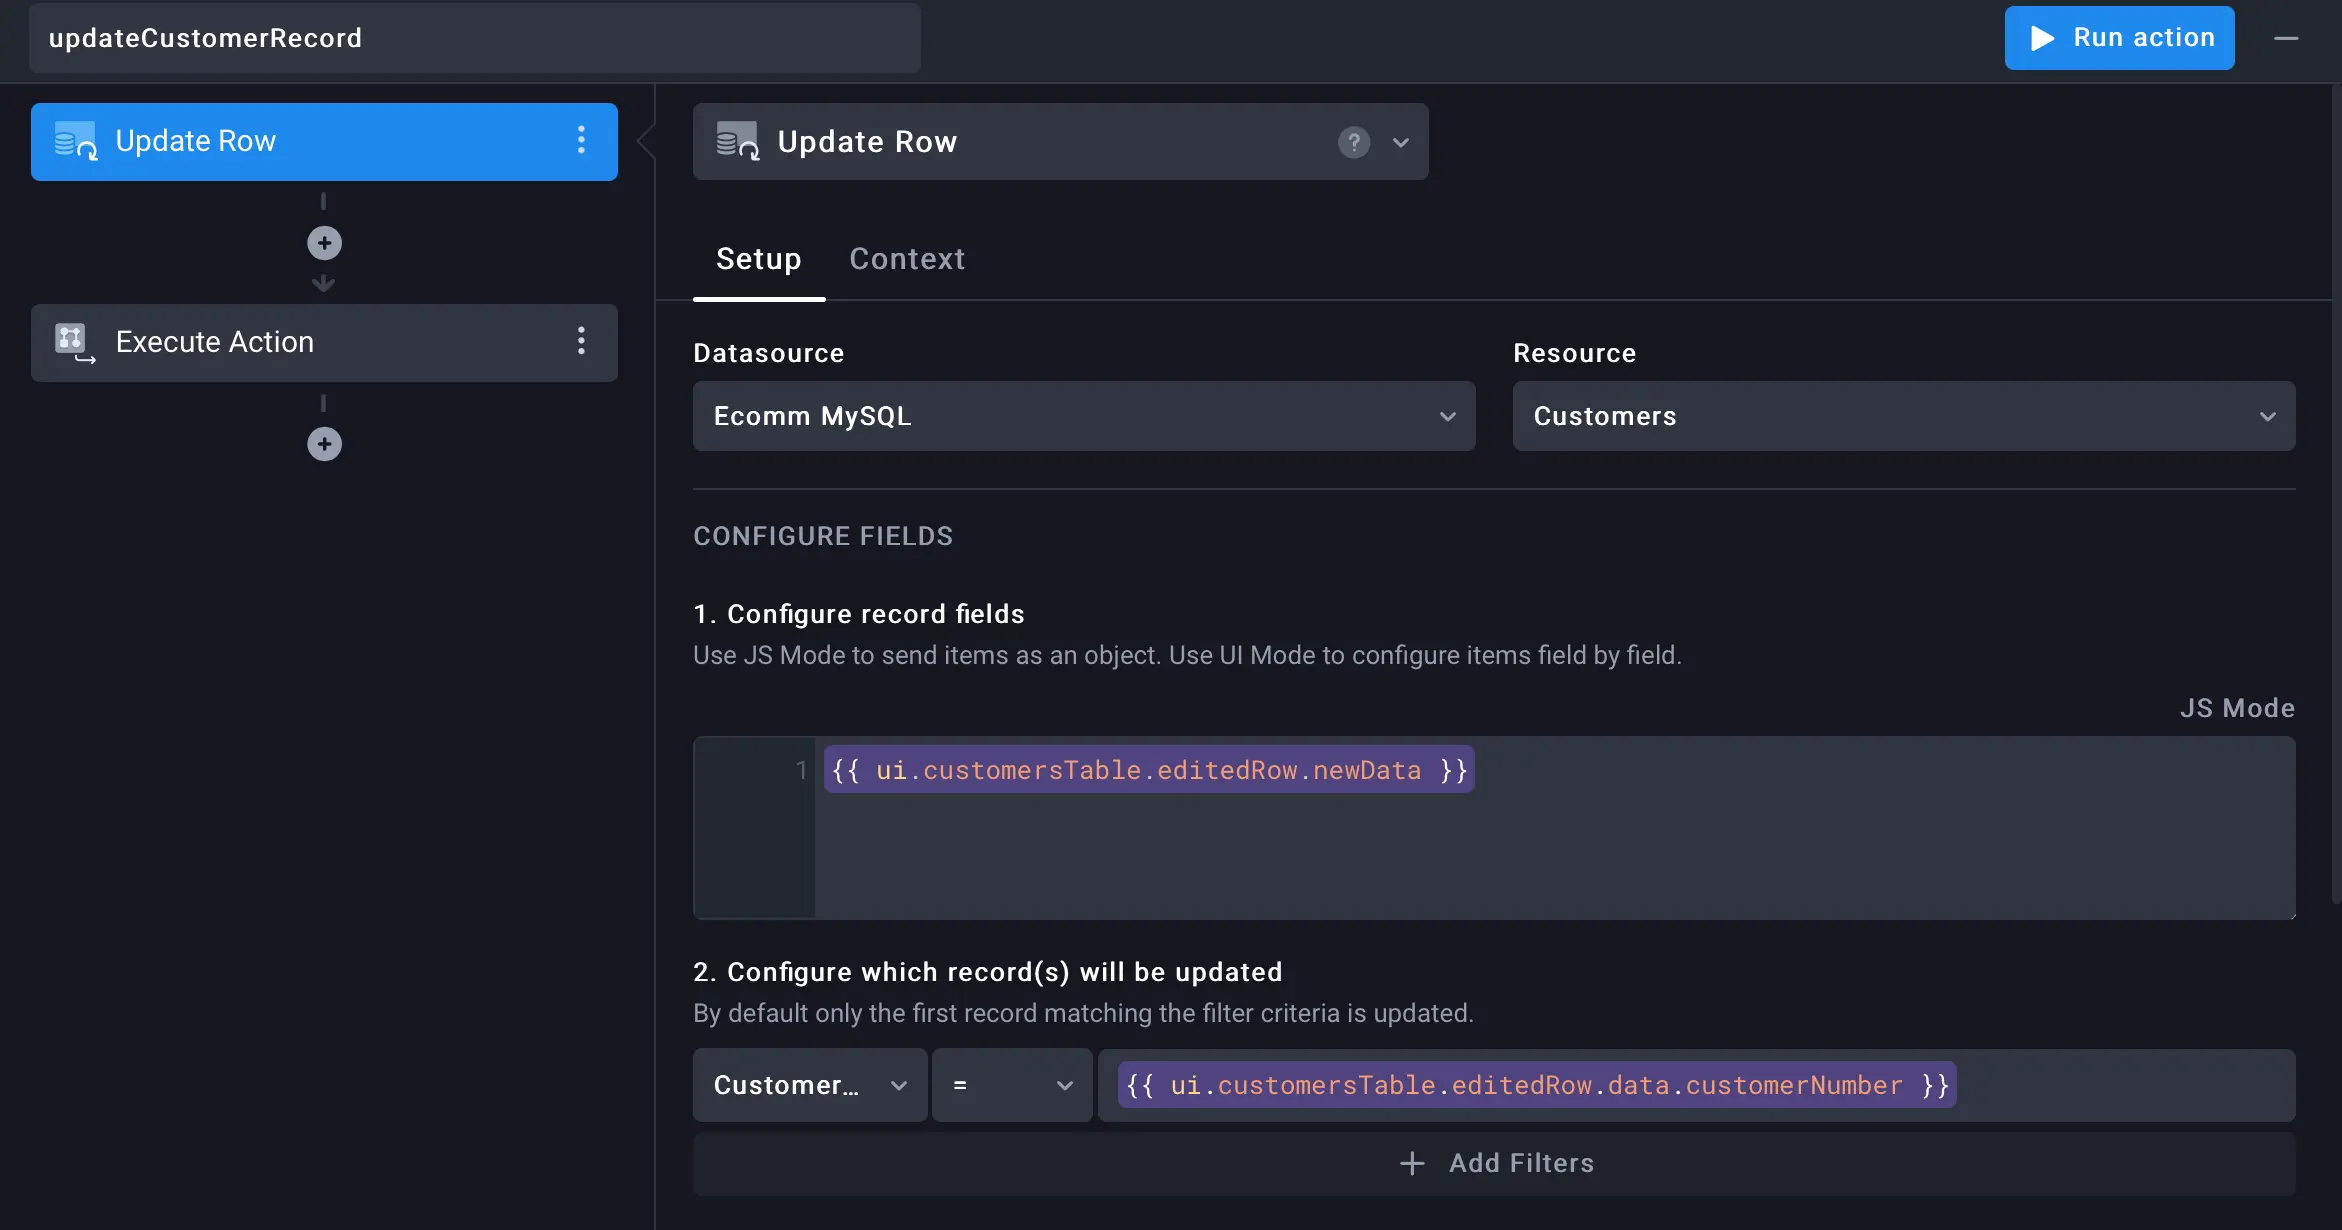
The next step is to create an Action to send the updated data back to your database. Add a new Action named “UpdateCustomerRecord”, and choose “Update Row” as an Action step. Use {{ ui.customersTable.editedRow.newData }} to define how to map the changes in the data. After that, you should define the record to be updated. For example, if you need to update the Customer numbers, use {{ ui.customersTable.editedRow.data.customerNumber }}. Finally, add an “Execute Action” step, and choose “loadCustomers”.
We need to define a Trigger that will call for the Action we’ve just added. To do it, go to the “Triggers” tab. Pick the “UpdateCustomerRecord” Action in the list in the “On Edit” Trigger.
Done with customization! Let’s deal with data filtering now.
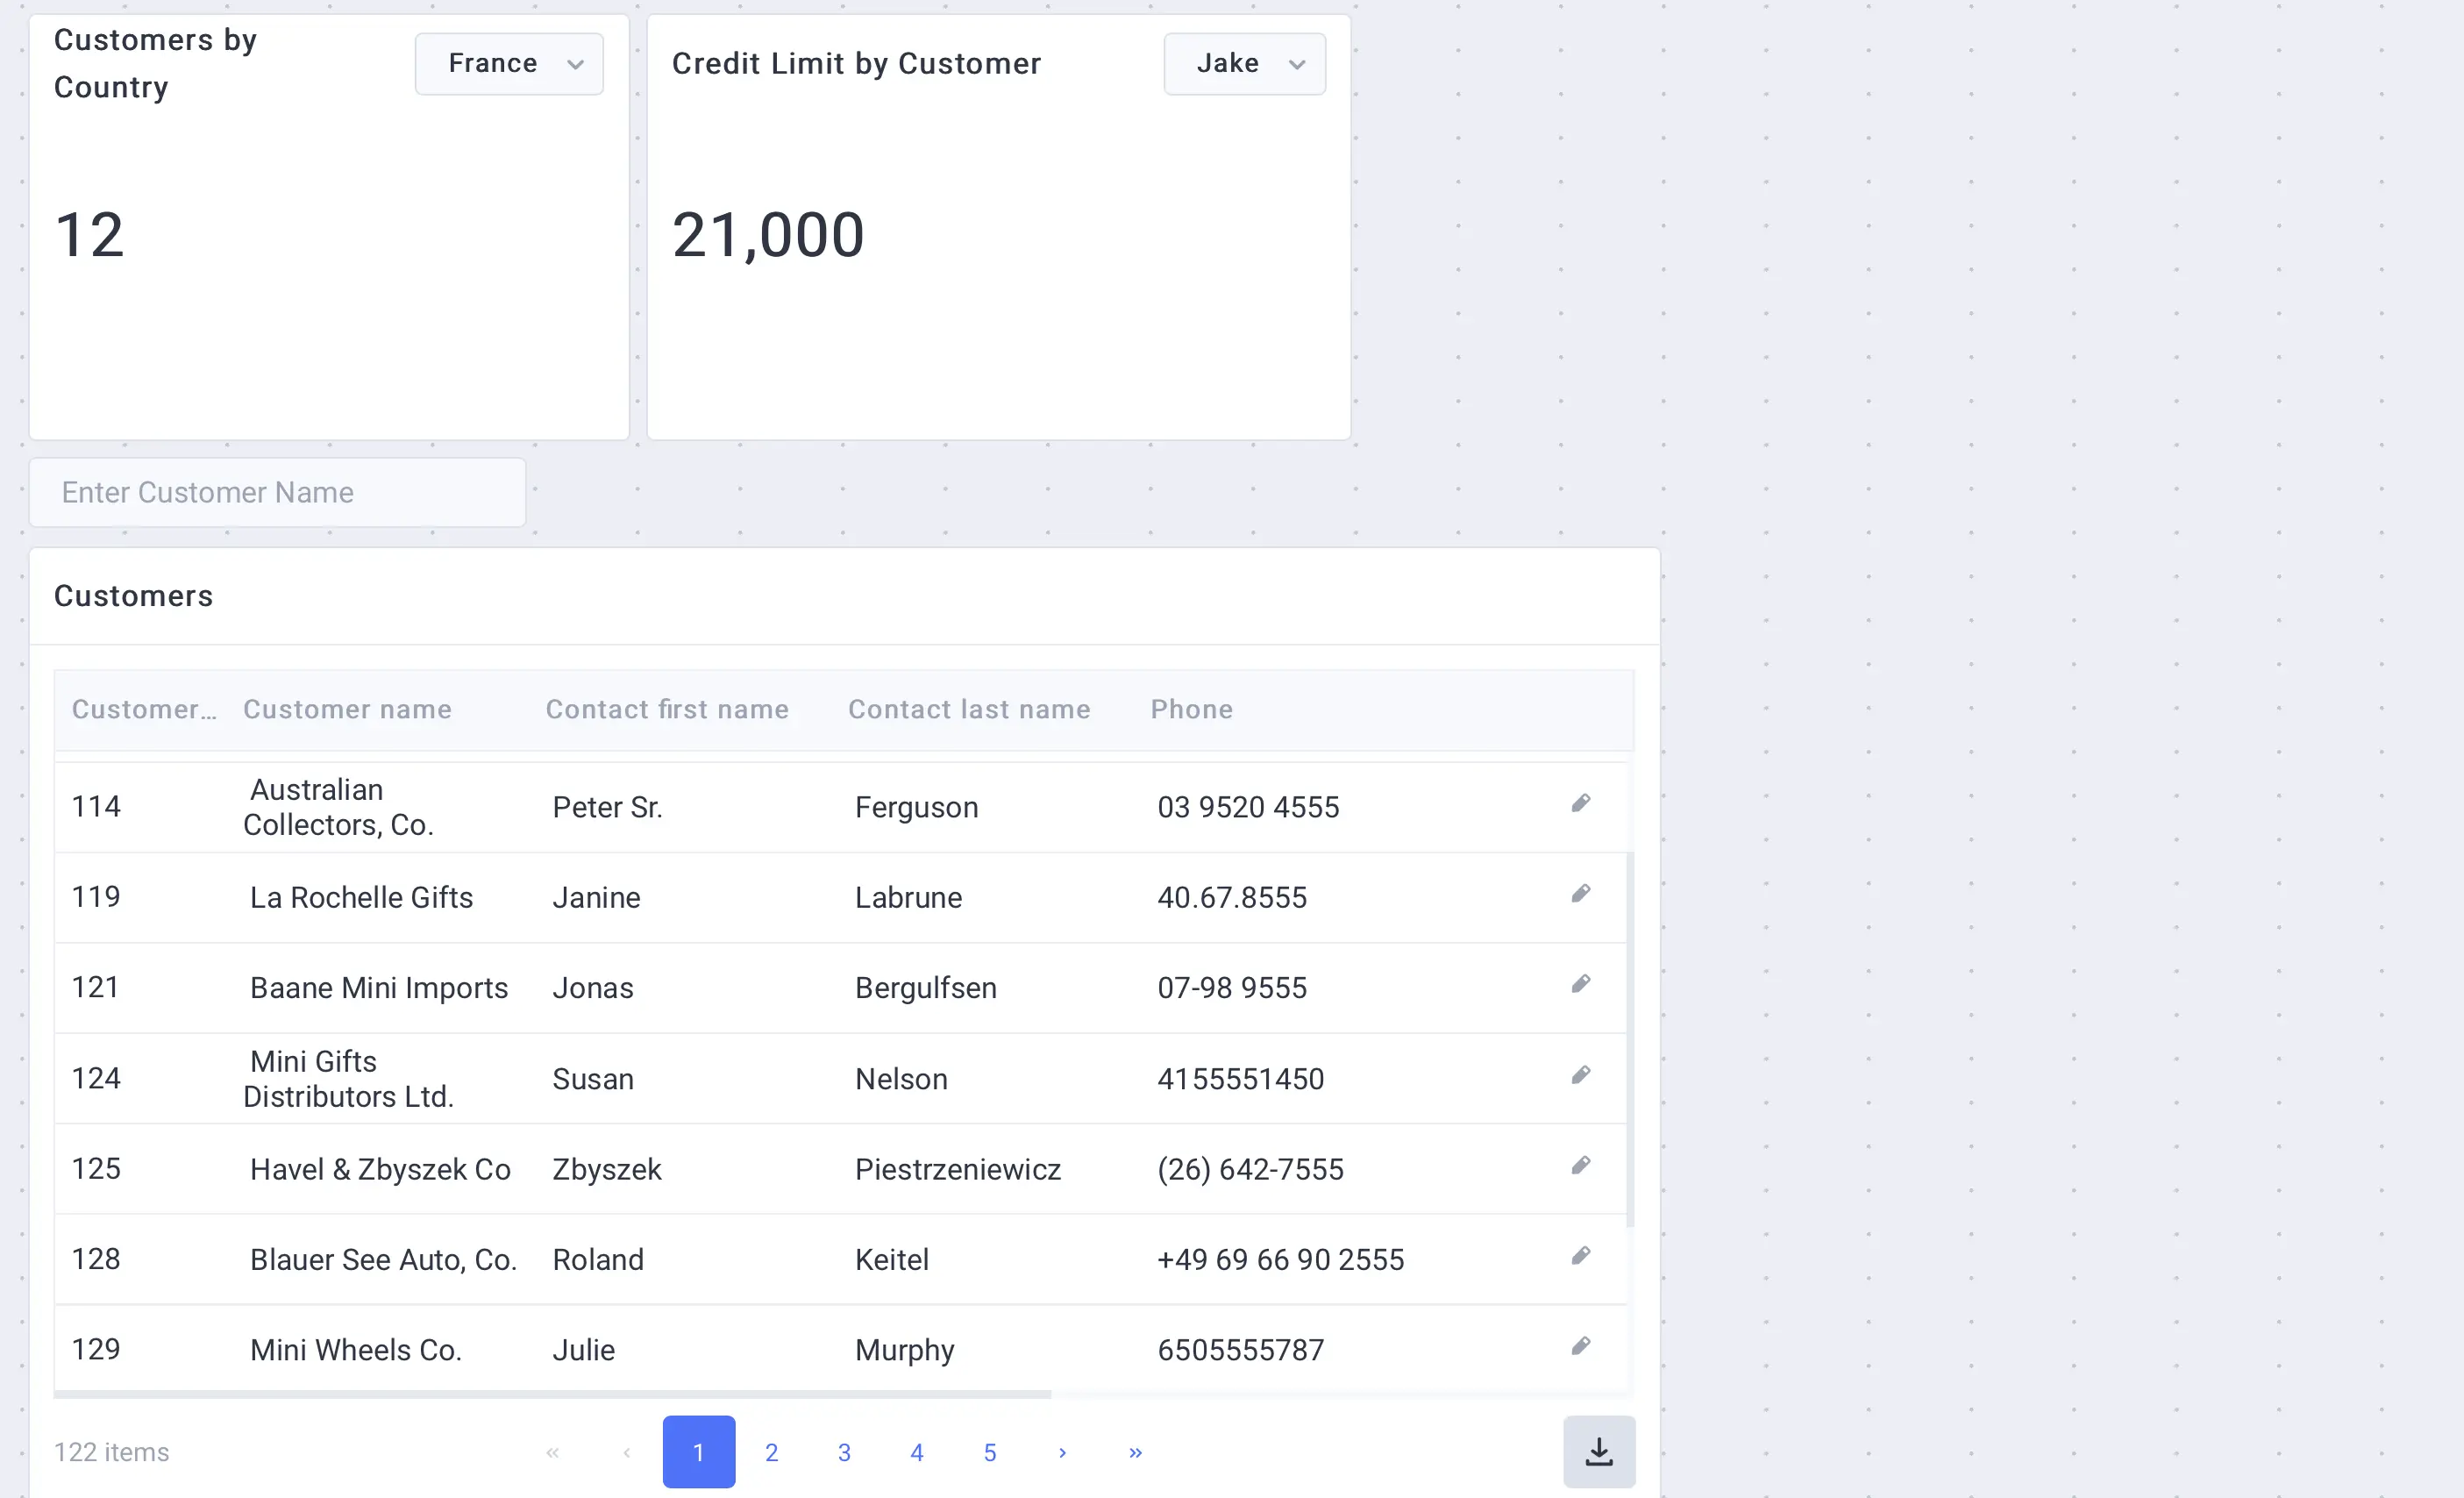
First, add an Input component to your working area from the components menu. Move to the “Appearance” tab, and use “Enter Customer Name” as a placeholder. In the Triggers, use the “loadCustomers” as the “On Change” trigger. And finally, add this filter Customer name = {{ ui.customerName.value }} in the “Filters” tab. Now, it will be much easier to navigate through your Table records.
Step 3. Add statistics to your dashboard
The more essential data is visualized, the more efficient your team’s work with the internal tool will be. Let’s see how to add different metrics, for example, the number of customer per country.
First, you need to add a Metric components from the components menu. Once the component is in its place, go to the Data field, and assign an appropriate action: reference to it using {{actions.loadCustomers.data}}. You can also change the metric name, for instance, “Customers per Country”. Further, set up the metric fields: set “Customer name” in the Main field grouped by “Count”.
Following the steps above, you can add any metric you need, e.g., credit limit by customer.
Step 4. Create a form to add new data
One of the key functionalities any internal tool must have is an ability to add new data – on the customers, orders, etc.
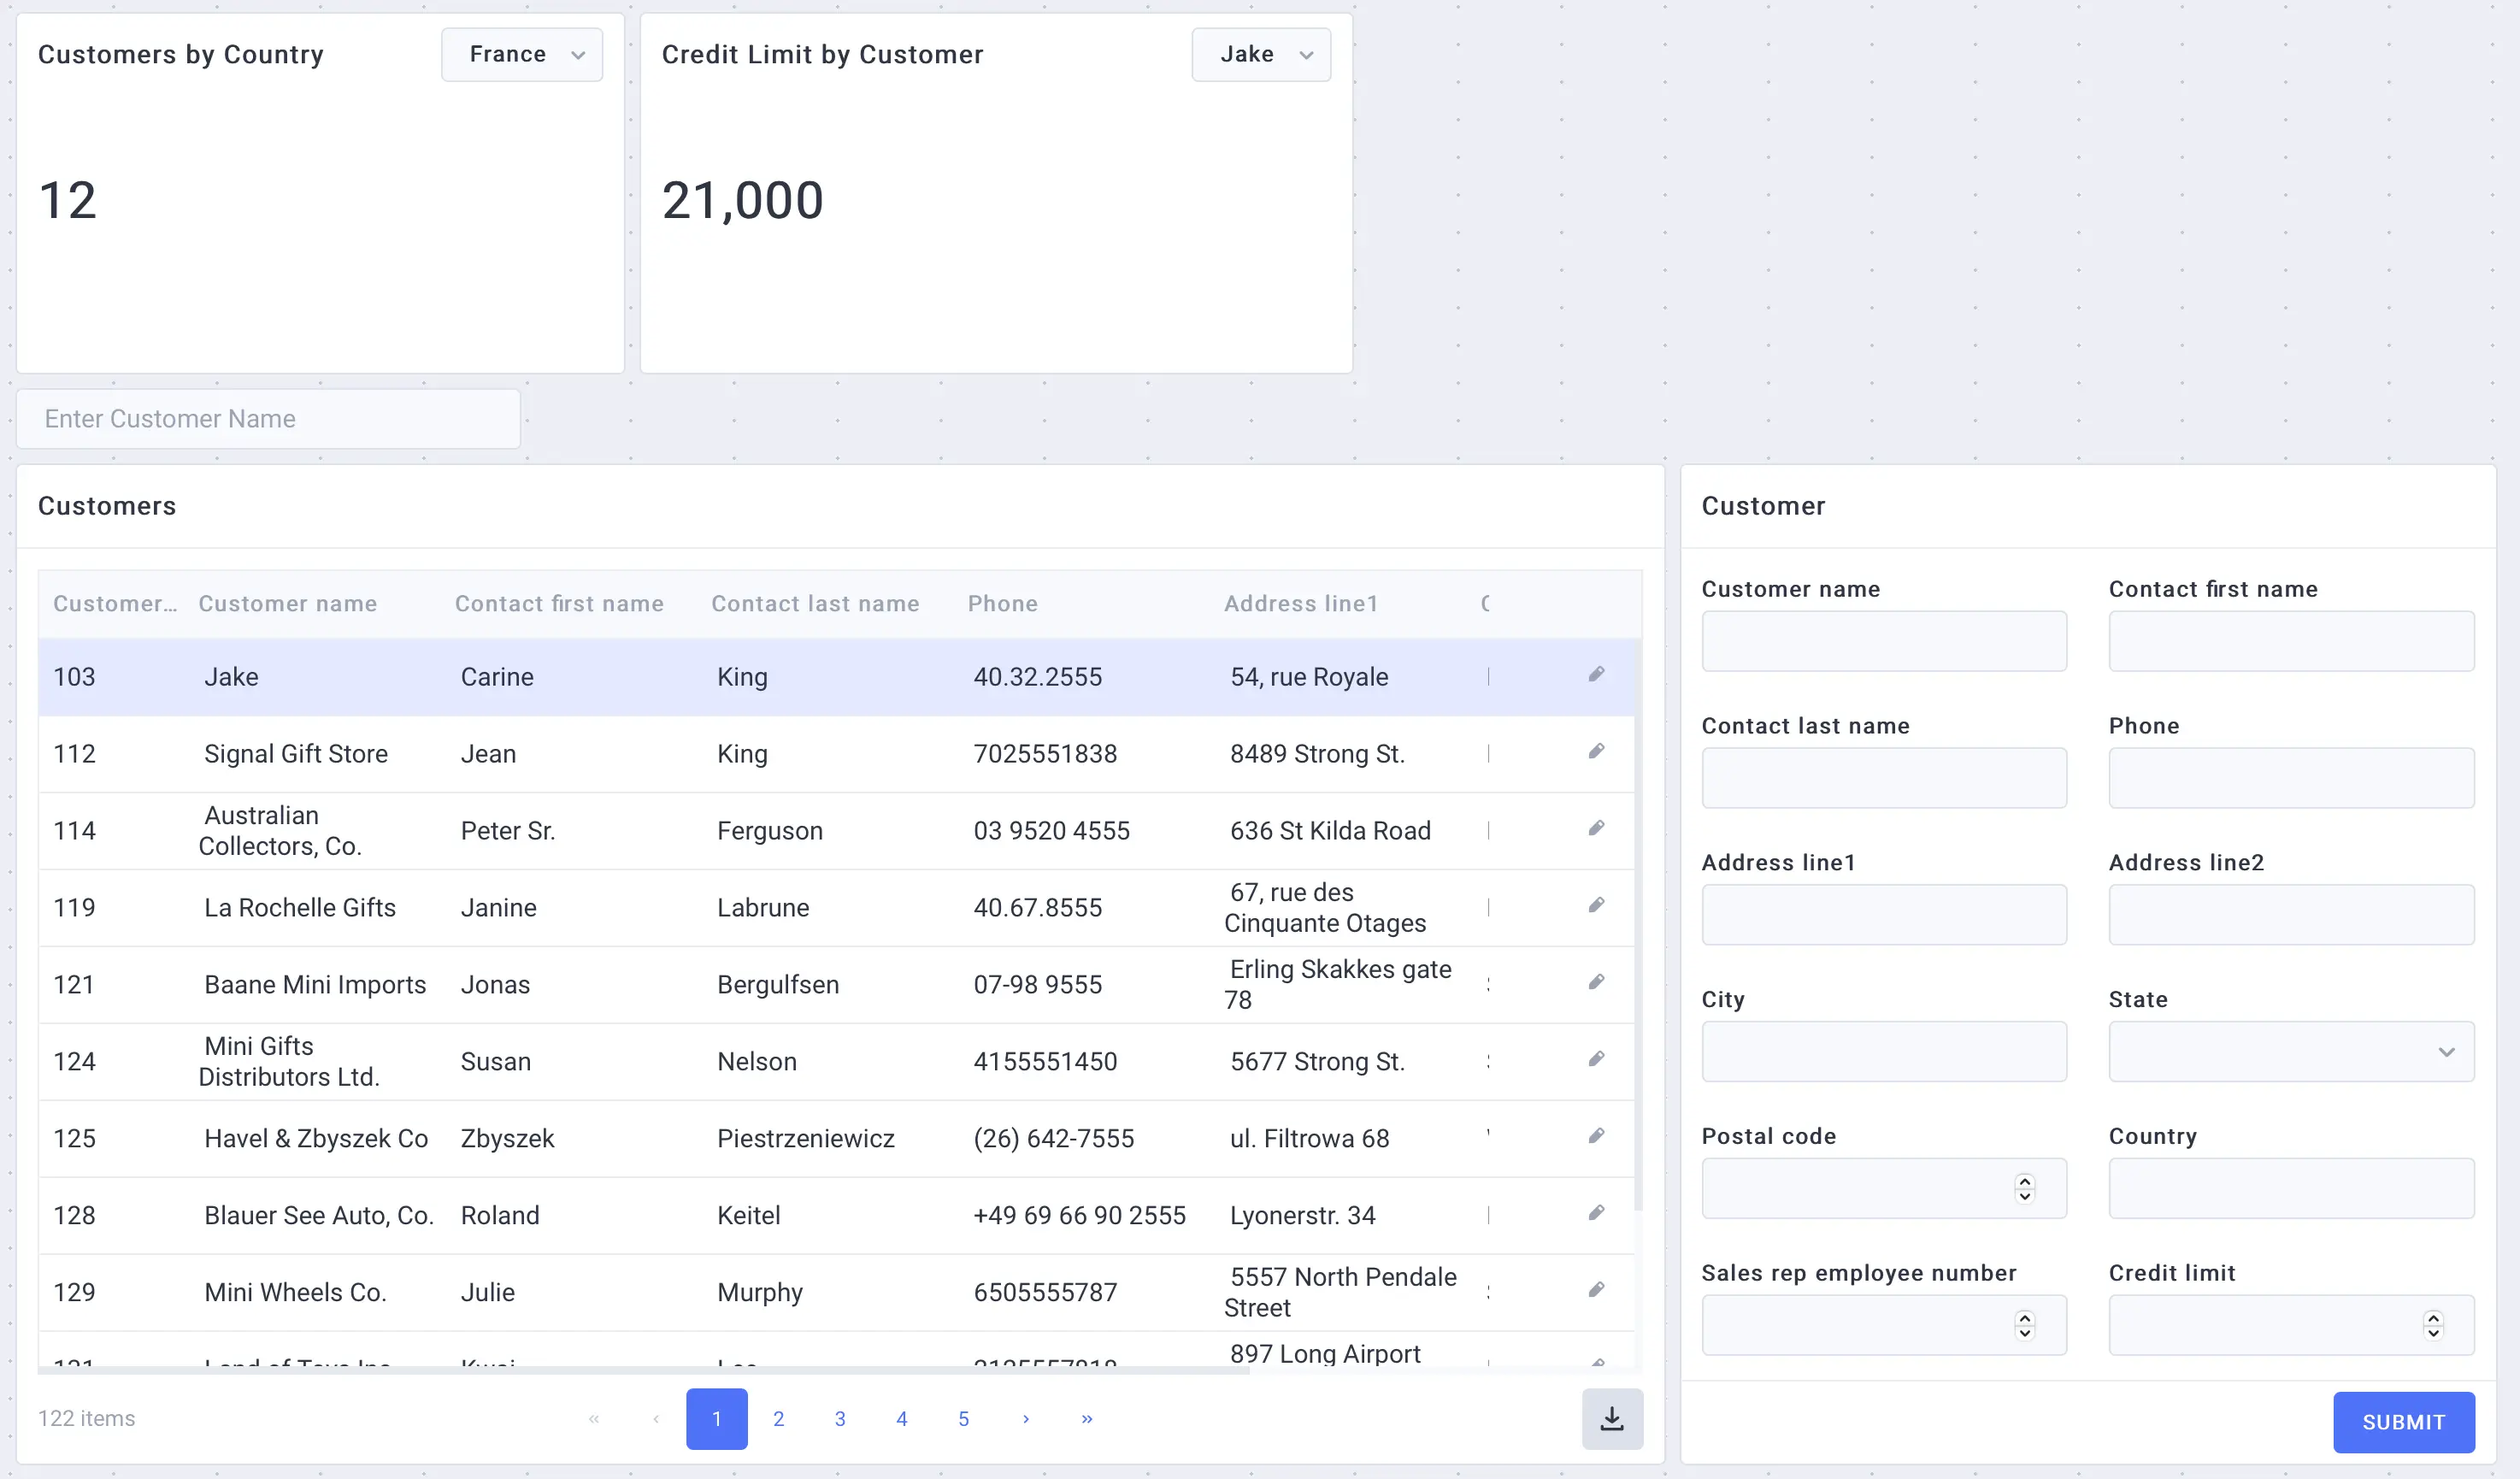
To start with, pick a Form component from the components menu and place it on your dashboard. The added Form will have the same structure as your Table has. You can change it by hiding any fields you don’t need in the Form.
When you enter new data into the Form, it must be sent to the connected data source. Let’s create a new Action to make it possible. First, add a new Action step named “Create Row”. Use {{ ui.customersTable.newRow.newData}} to identify new records and enable data mapping. And the last thing to do within this step is to add an action step “Execute Action”, and pick “loadCustomers” from the dropdown.
We need to bind the created Action to the Trigger. Go to the Triggers tab, and choose “createCustomers” from the list in the “On Submit” field.
Step 5. Add a Details page
Now, we need to create a page that will host and view the necessary information on each Customer (their contact details, orders, region, and more).
Let’s start with adding a new page and naming it appropriately – “Customer details”. Now, we need to add navigation to this page. Get back to the main page, and let’s work with the “Customers” Table. We need to make sure that the “Customer details” page will be opened upon the implementation of certain conditions.
First, we need to go to the “On Row Select” Trigger located in the Triggers tab. In the dropdown, choose “Add New Action” → “Condition”. In the Setup field here, type: return {{ ui.loadCustomersTable.selectedRow.index}} >= 0;.
Once we’ve created the Condition step, let’s add “Navigation” for the “True” condition. Type {{ routes.customerDetails.url }} in the “Page Path” field, and add the following query parameters: id {{ ui.loadCustomersTable.selectedRow.data.customerNumber}}.
To make the Details page more valuable, we need to add some more components. Follow the next steps:
- Add a Details component.
- Add a new Action step named “Load Row”. We need it to view the data on the selected record.
- Configure a filter to retrieve a row: choose “Customer Number”, = {{ activeRoute.queryParams.id}}.
- Click at any place within the Details component, and assign the created Action via the Data field using {{ actions.loadCustomerInfo.data }}.
Check if everything works correctly: when you select a certain row in the “Customers” Table, you’ll be directed to “Customer Details”.
We need this internal tool to provide us not only with the information on the customers but on their orders as well. Let’s add a Table that will contain the orders data. Add an Action – “Load Table” – and define a source and a resource for this Action. We need to add a filter to make sure that the only data viewed are the data on the selected Customer. To enable filtering, set “Customer Number”, ={{ activeRoute.queryParams.id}}. To display the customers’ orders, pick a Table component from the components menu, and add it to the working area.
Step 6. Add data visualization
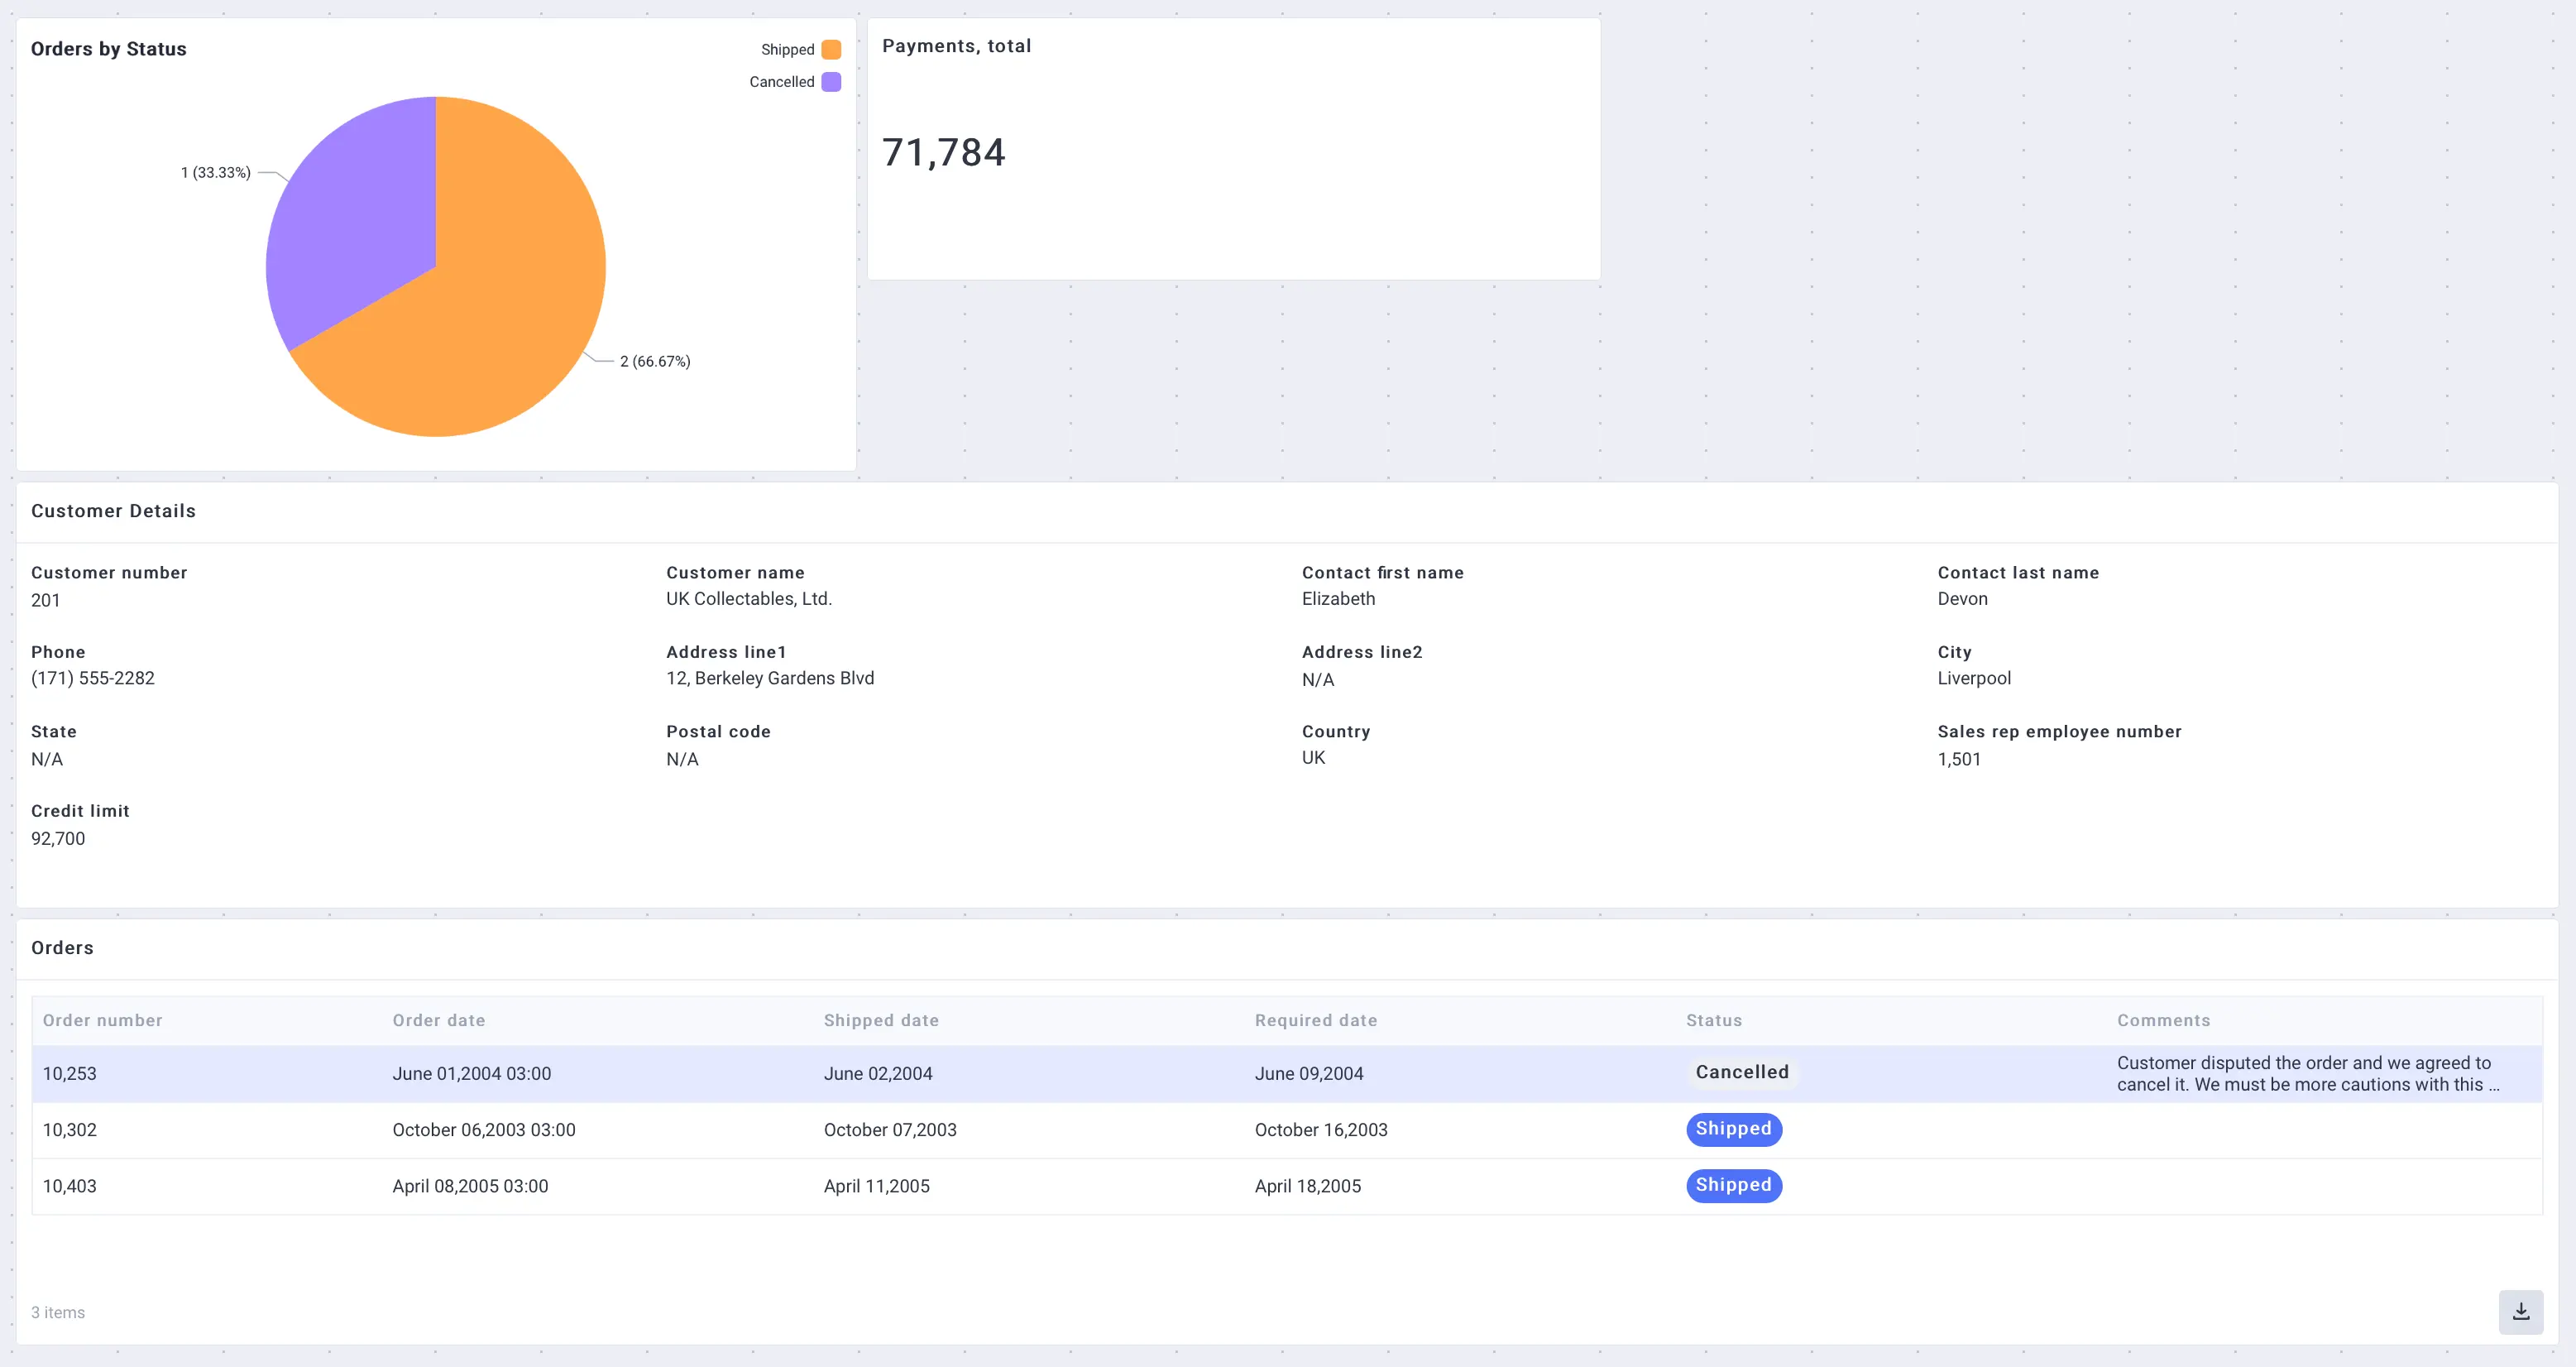
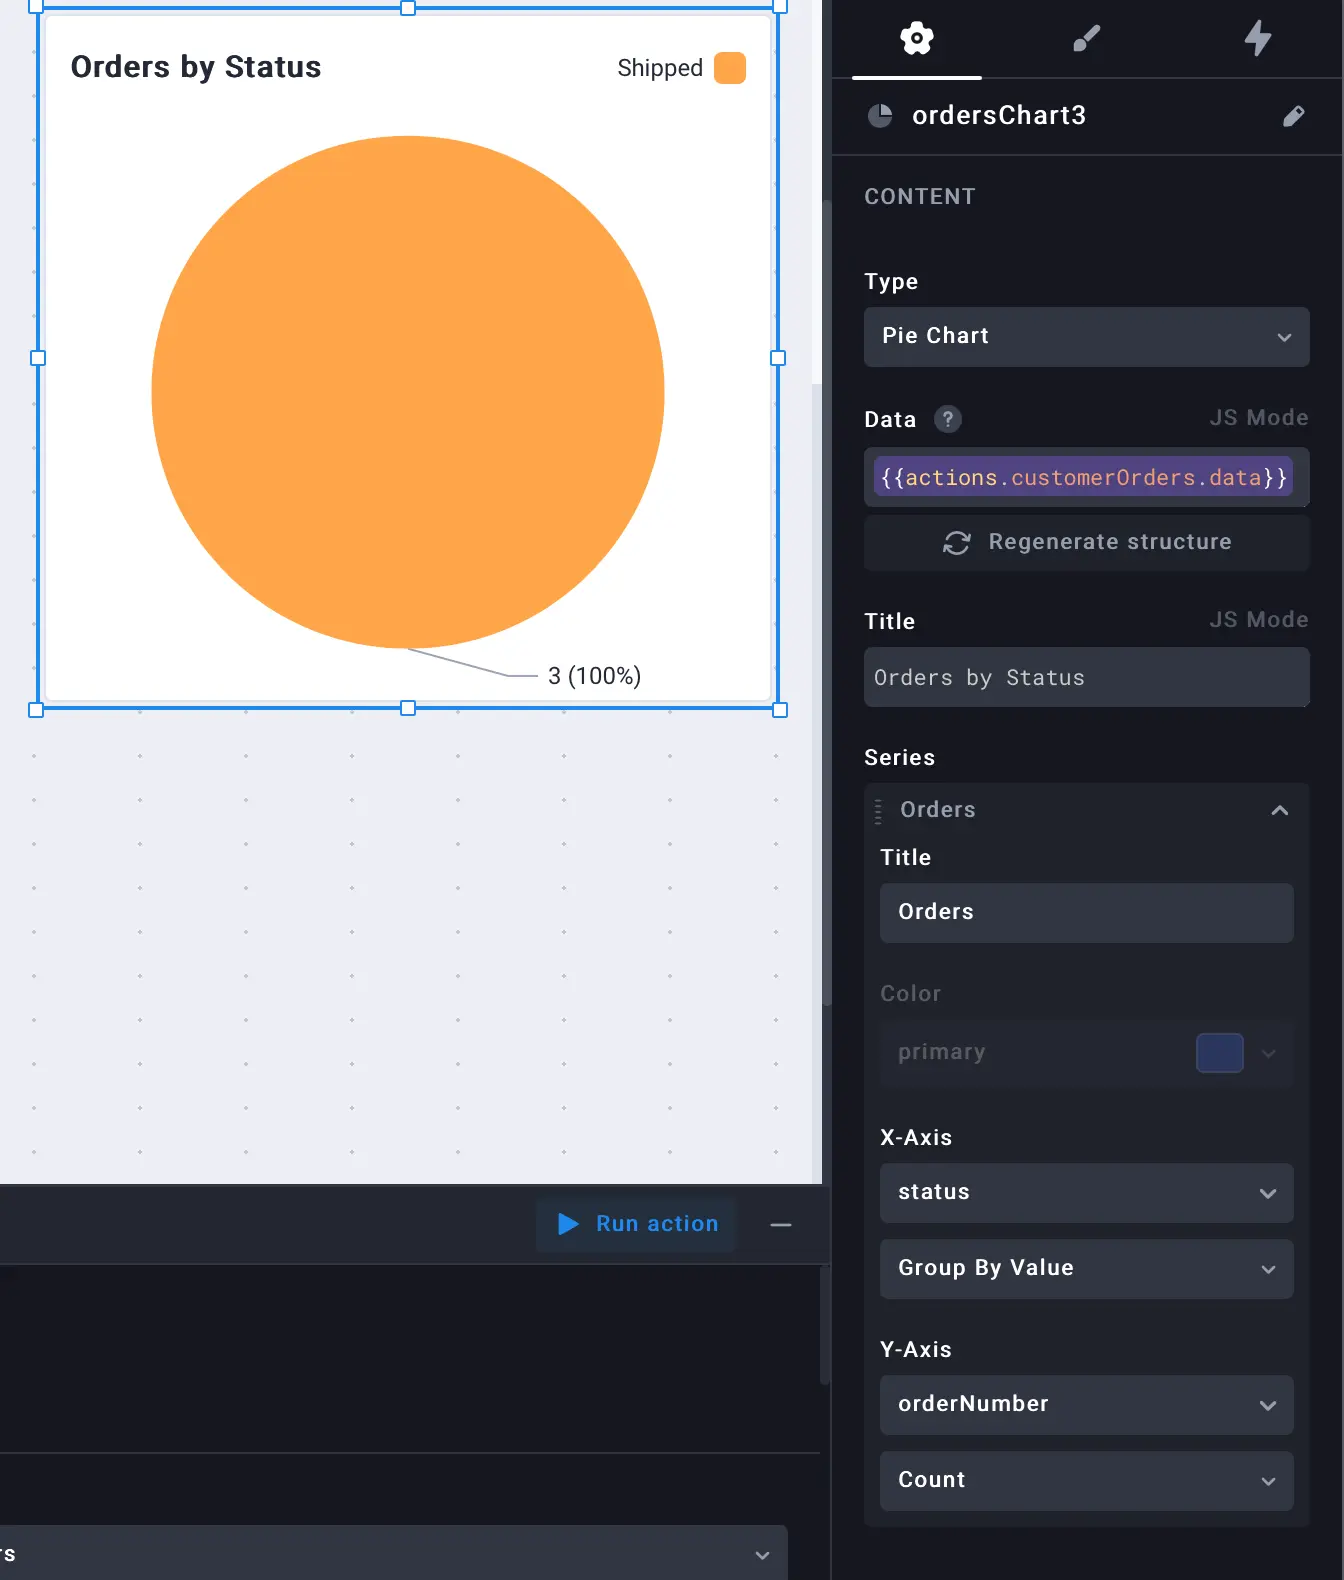
To make the Customer page more convenient to use, we need to add some visualized metrics to our internal tool. For example, you can add a pie chart using a pie chart maker to clearly display customers’ orders based on their order statuses.We’ll use it to display the customers’ orders based on the order statuses. Add a Chart component to the working area, and choose its type – “Pie”.
Go the Data field, and type {{actions.customerOrders.data}}. Move down to “Series”, select “status” in the “X-Axis” tab, specify “Group By Value”, and select “orderNumber” for the “Y-Axis” tab grouped by “Count”.
One more important metric we can and should visualize for the customer dashboard is the number of payments every customer has made. To do it, add a Metric component, create a new Action step – “Load Table” – and select “Payments” Table as a resource. Use the following data to properly configure the selected record field: set “Customer Number”, ={{ activeRoute.queryParams.id}}. Paste {{ actions.customerPayments.data }} into the “Data” field. Give this metric a name (for example, “Payments, total”), and configure it: Main field – “amount”, select “Sum” below, group by – ”Don’t Group”.

Final step. Share your internal tool with the team
A functional internal tool tailored to display the customers info, orders details, payments information, etc. is ready. We've visualized the most essential data and added the needed metrics.
Now, when the app is ready, you can share it with your colleagues, investors, stakeholders, etc. Publish your internal tool using the relevant button at the right corner above the working area, and get the application’s link to send to your team members. Don’t forget to specify whether you need your orders tracking tool to be public or private.
Find more step-by-step guides in the UI Bakery documentation. Or simply contact our team if you have some specific ideas in mind that you’re planning to implement with UI Bakery. We’ll show you around and help you build the first version of your internal tool.


"The UI Bakery platform offers a cost-effective approach to creating applications. With UI Bakery, you can achieve your app development goals without breaking the bank."

"Before switching to UI Bakery we developed a number of apps within the Retool system. The Retool system was good but ultimately did not have the flexibility and feature sets that we required."
Check the Story