
Top Internal Analysis Tools for 2026

Updated:
January 23, 2026
In 2026, internal analysis is no longer just about dashboards. Companies analyze performance, behavior, and operations – and then expect teams to act on insights immediately. As a result, the strongest stacks combine classic BI, product analytics, and internal tooling platforms that turn insights into workflows.
This guide focuses on the five best tools shaping internal decision-making today. Together, they cover the full spectrum of tools for internal analysis of a company – from executive reporting to hands-on operational execution.
1. Microsoft Power BI – Enterprise BI and reporting standard
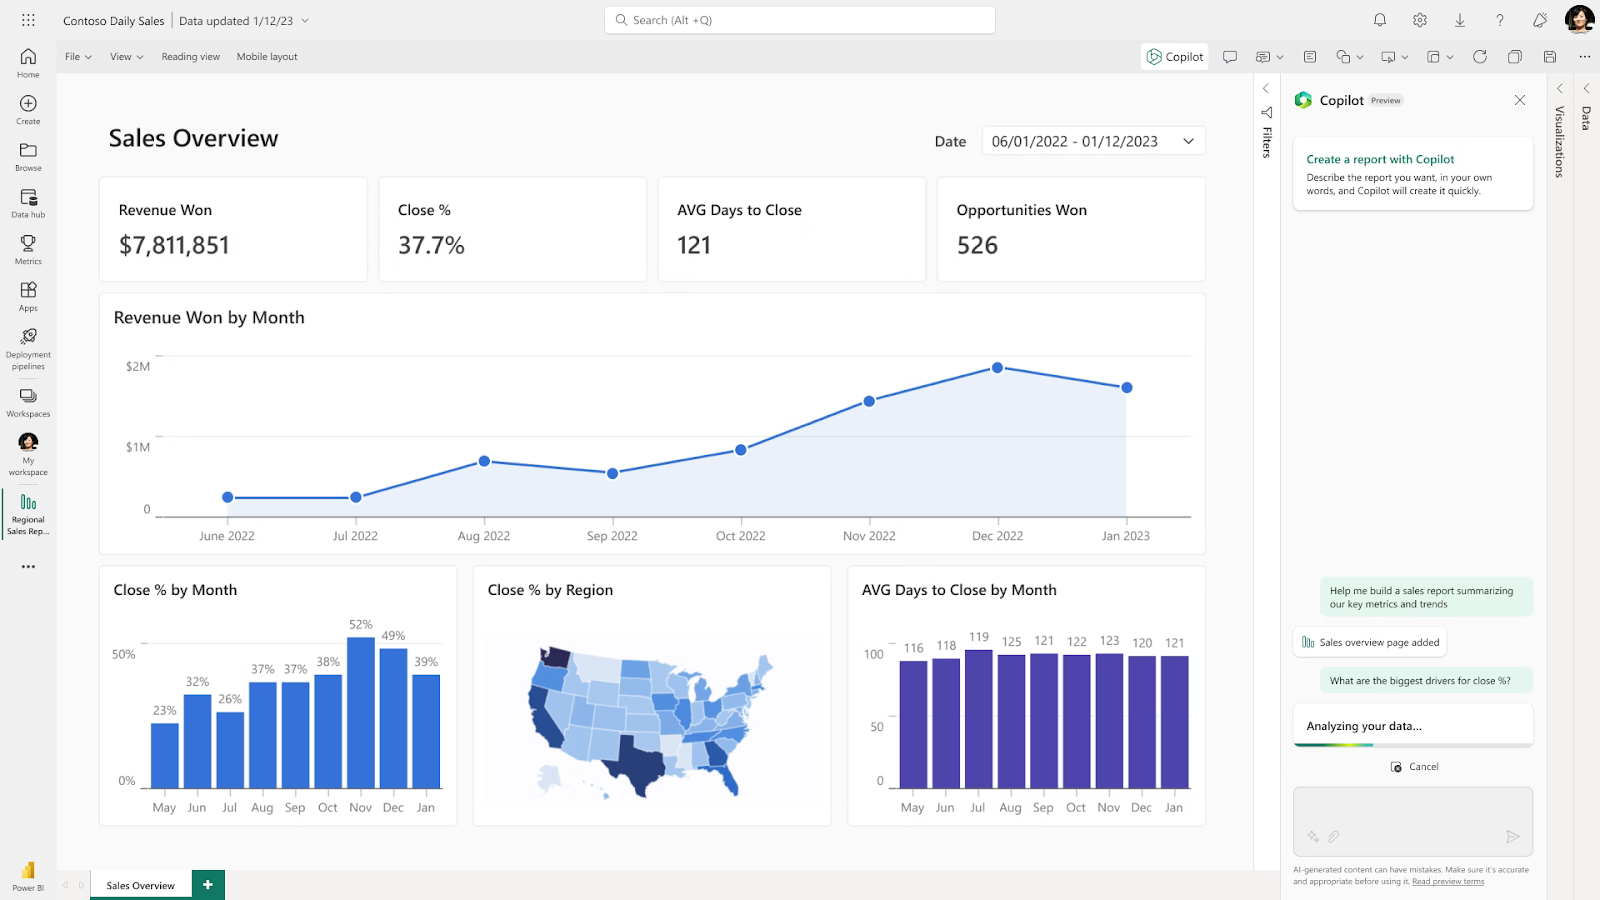
Microsoft Power BI is one of the most widely adopted internal analysis platforms, especially in organizations already using Microsoft’s ecosystem. Connecting to various data sources, it focuses on standardized reporting, executive dashboards, and governed data models across departments.
Key strengths
- Enterprise-grade governance and sharing.
- Deep integration with Microsoft tools.
- Familiar reporting workflows.
Key features
- Semantic models for reusable metrics.
- Advanced dashboards and paginated reports.
- Role-based access and administration.
Pros
- Scales well across large organizations.
- Strong for executive and financial reporting.
- Broad talent pool and community support.
Cons
- Can become complex to manage at scale.
- Limited support for operational workflows.
Best for: companies that need standardized internal reporting and broad adoption across teams.
2. UI Bakery – AI-generated apps on top of your data
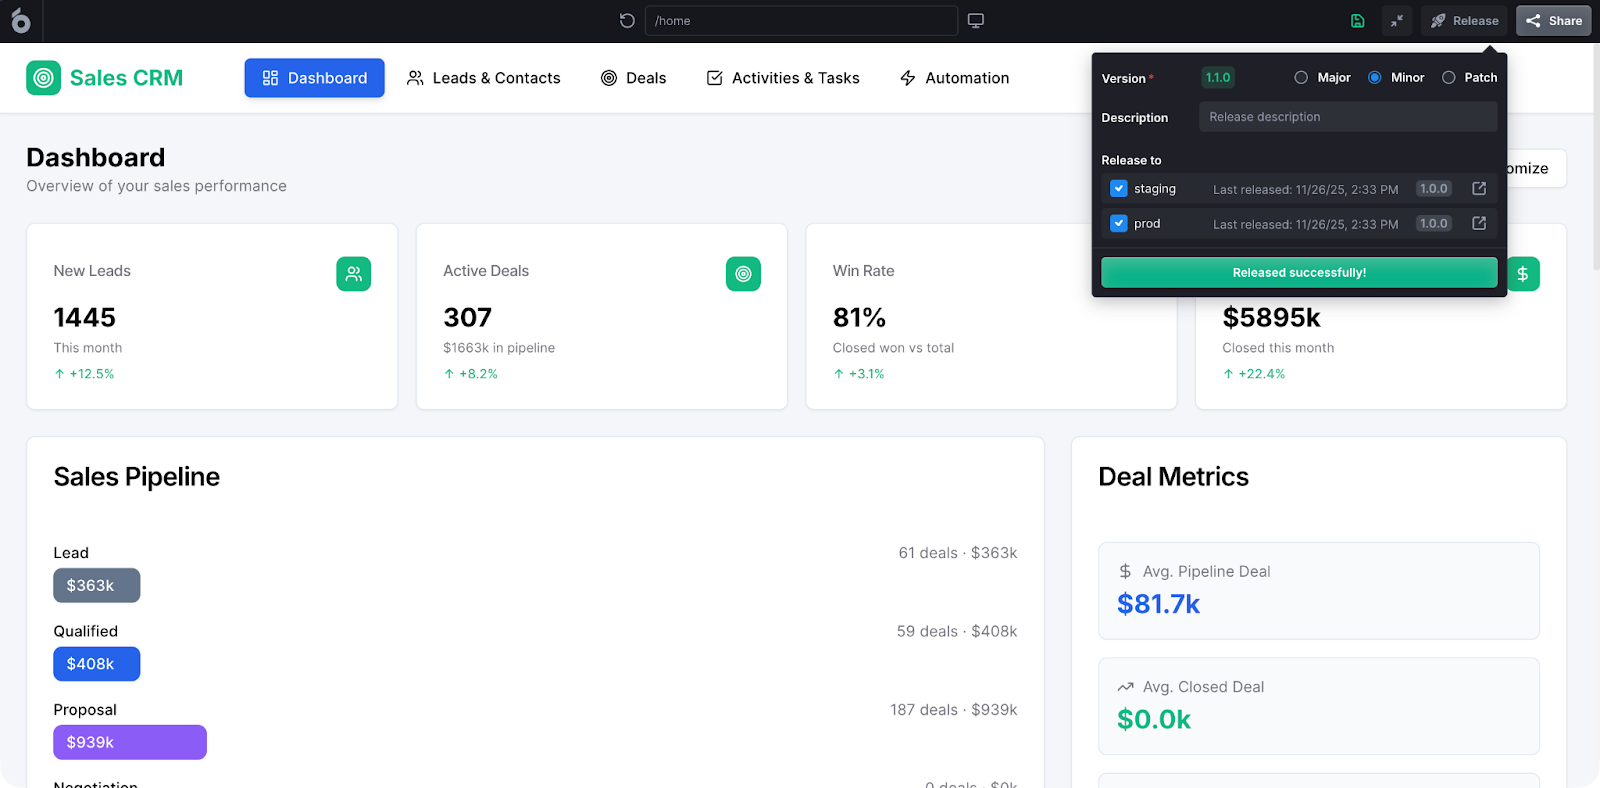
UI Bakery is an AI agent designed specifically for building internal tools on top of real company data. Unlike traditional BI tools, it goes beyond analysis by letting teams create interactive internal applications, dashboards, admin panels, approval flows, and data editors directly connected to live databases and APIs.
In 2026, UI Bakery is increasingly positioned as a low-code platform with AI that helps generate, evolve, and maintain these internal apps.
Key strengths
- Combines analysis and execution in one place.
- Built for internal apps, not just charts.
- Strong fit for operational and data teams.
Key features
- Native connections to SQL databases and APIs.
- Visual UI builder for dashboards and internal systems.
- Workflow logic for approvals, validations, and actions.
- AI assistance for scaffolding and iteration.
Pros
- Turns insights into real internal workflows.
- Reduces dependency on engineering teams.
- Works with live production data.
Cons
- Not a pure BI replacement for company-wide metric governance.
- Requires structured data sources to get full value.
Best for: ops, data, and product teams that want internal strategy analysis tools that don’t stop at reporting, but enable action.
3. Tableau – advanced visualization and exploratory analytics
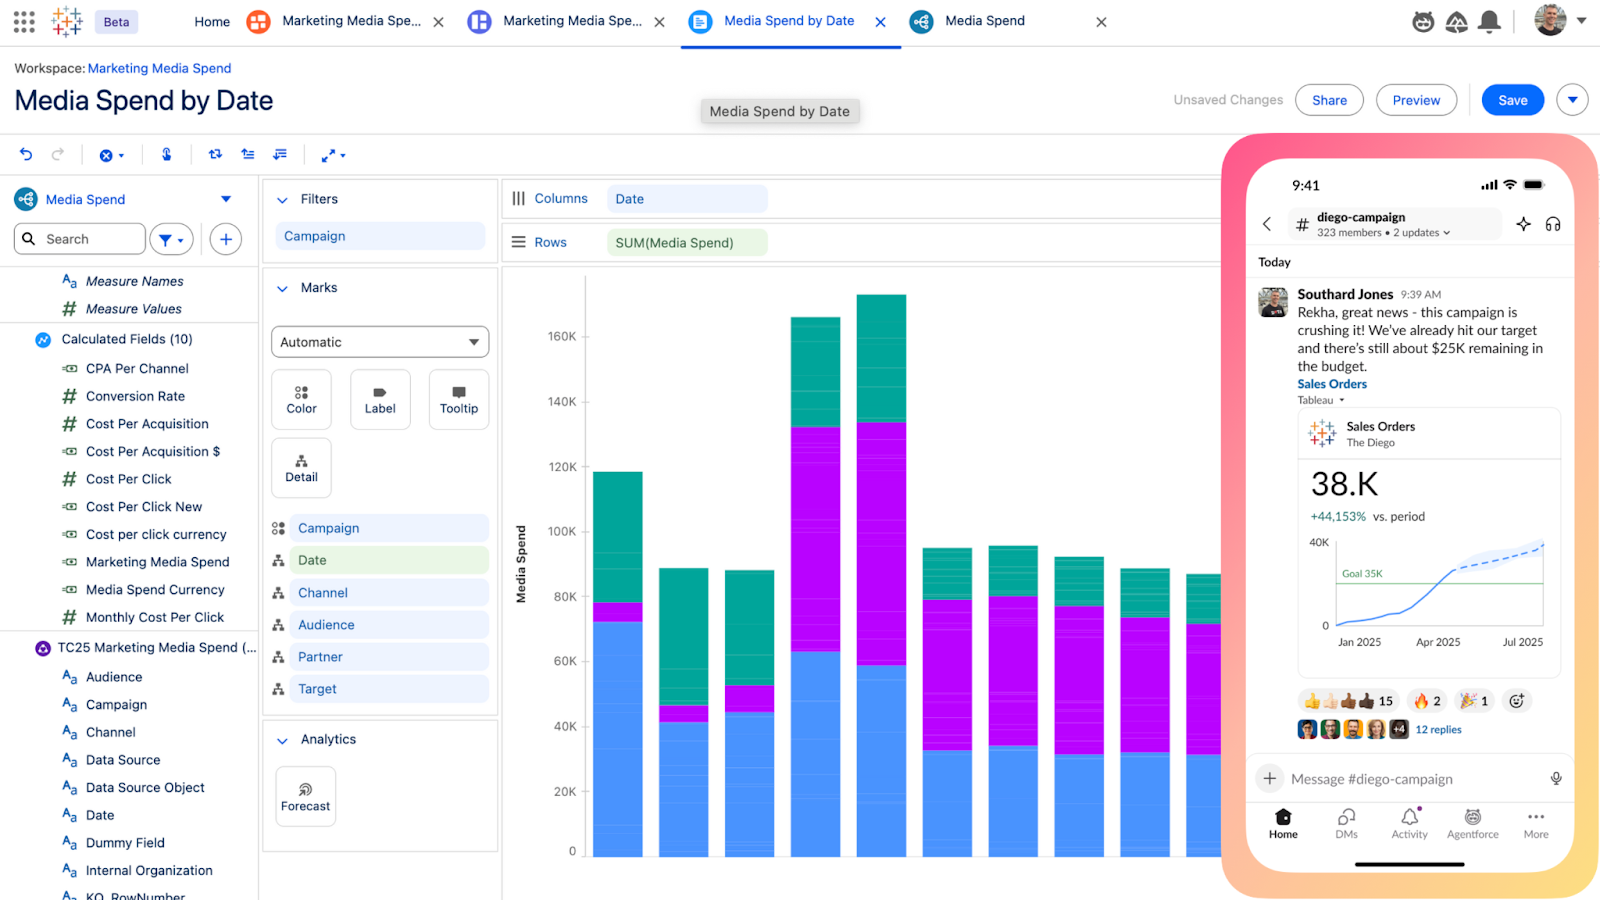
Tableau is a business intelligence and data visualization platform that allows users to connect to various data sources, create interactive dashboards, and analyze complex data without needing coding experience. It excels at helping analysts and business users see patterns, tell data stories, and communicate insights clearly to stakeholders.
Key strengths
- Industry-leading visualization quality.
- Flexible exploration for analysts.
- Strong storytelling capabilities.
Key features
- Drag-and-drop visual analytics.
- Interactive dashboards and drill-downs.
- Large ecosystem of extensions.
Pros
- Excellent for insight discovery and presentations.
- High adoption among analysts and leadership.
- Strong cross-industry reputation.
Cons
- Can be expensive at scale.
- Governance depends heavily on the data modeling discipline.
Best for: teams prioritizing visual exploration and stakeholder-ready insights.
4. Google Looker – governed metrics through a semantic layer
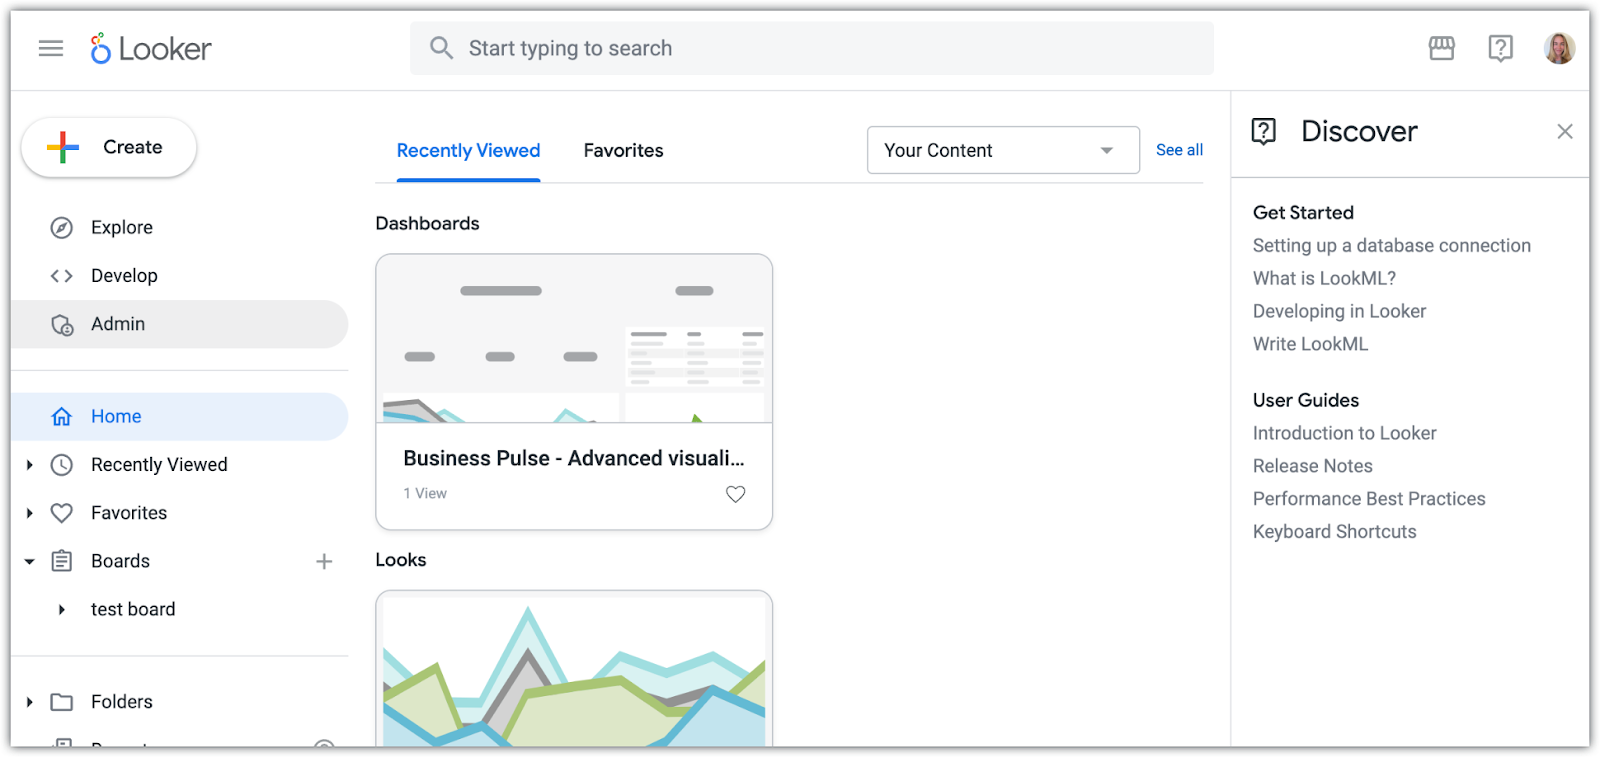
Google Looker is an enterprise-level BI and data analytics platform that helps organizations visualize, analyze, and share real-time data from various sources. Using LookML, it defines business metrics once in a semantic model and reuses them consistently across dashboards, reports, and embedded analytics.
Key strengths
- Strong metric consistency across the company.
- Centralized definitions reduce reporting conflicts.
- Designed for scalable analytics.
Key features
- Semantic modeling layer for KPIs.
- Reusable metrics across dashboards.
- Embeddable analytics for internal tools.
Pros
- Eliminates “multiple versions of truth”.
- Good fit for data-mature organizations.
- Scales well with growing analytics needs.
Cons
- Requires modeling expertise.
- Slower iteration for ad-hoc analysis.
Best for: organizations that value governance and consistency over rapid experimentation.
5. Amplitude – product and behavioral analytics
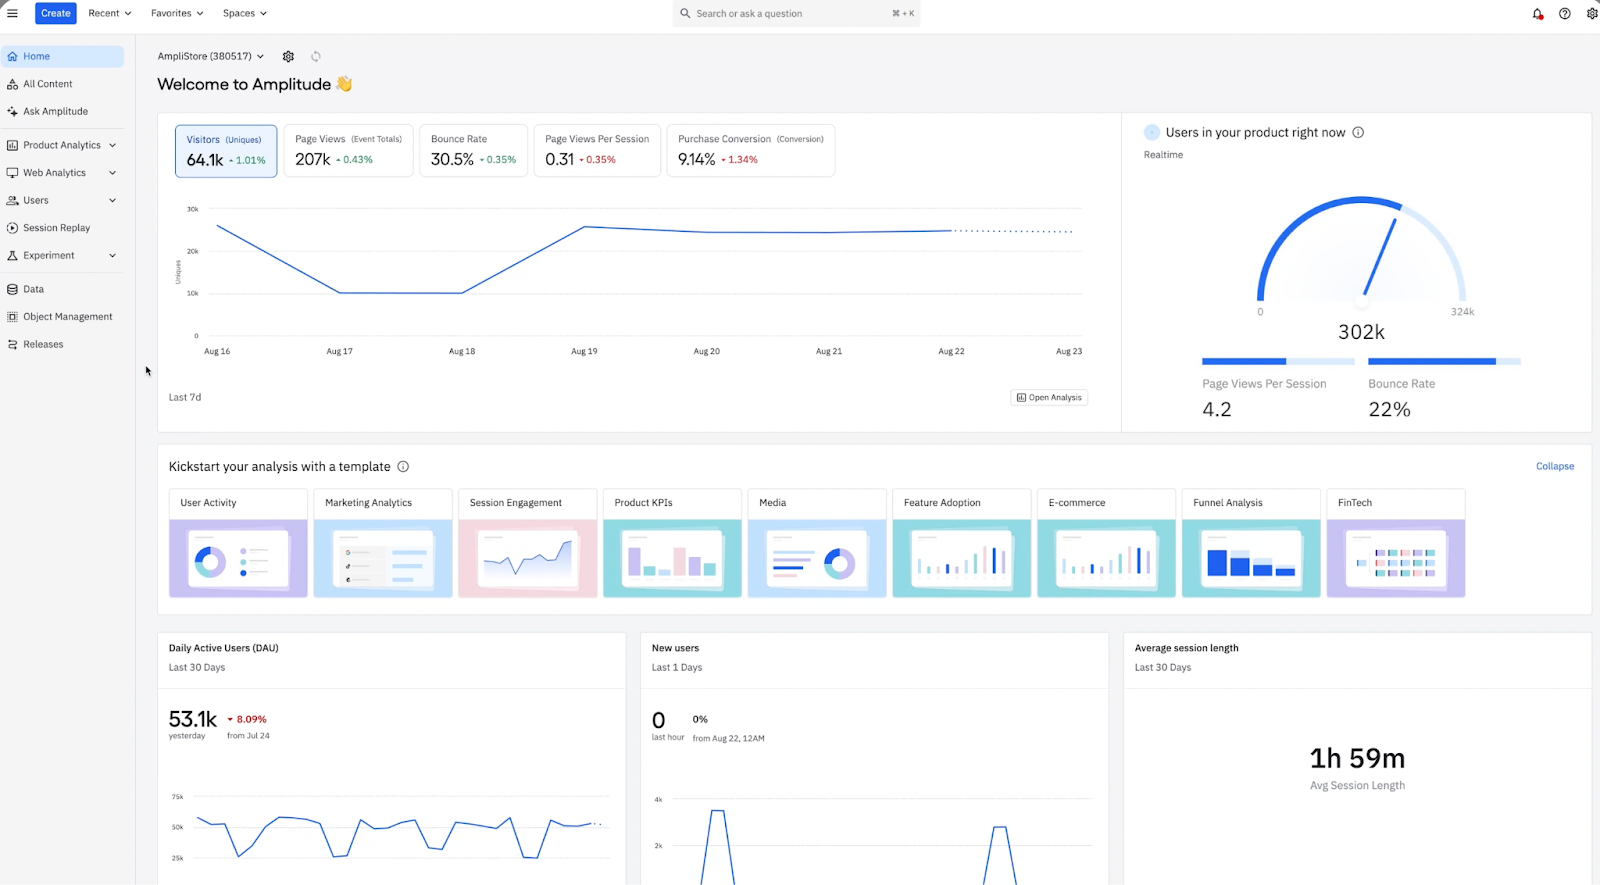
Amplitude is a real-time data analytics platform that focuses on understanding how users behave inside digital products. While it’s not a general BI tool, it plays a critical role in internal decision-making for product-led organizations by connecting features and changes to real business outcomes.
Key strengths
- Deep behavioral and cohort analysis.
- Designed for product and growth teams.
- Clear visibility into user journeys.
Key features
- Funnels and retention analysis.
- Behavioral cohorts and segmentation.
- User path and journey analysis.
Pros
- Excellent for optimizing products and features.
- Strong experimentation support.
- Helps link product decisions to revenue and retention.
Cons
- Limited value outside product analytics.
- Requires careful event instrumentation.
Best for: product, growth, and UX teams driving product-led strategies.
How these tools work together in 2026
Most companies don’t rely on a single platform. A common modern setup looks like:
- Power BI or Looker – standardized company metrics.
- Tableau – deep exploration and storytelling.
- Amplitude – product behavior analysis.
- UI Bakery – turning insights into internal actions and workflows.
Together, these internal analysis tools cover reporting, exploration, behavior, and execution – the four pillars of modern internal decision-making.
FAQ
Is Tableau better for exploration or for formal reporting?
Tableau is primarily used for exploratory analysis and data storytelling, rather than strict, centrally governed reporting.
Do I need both BI tools and low-code platforms?
Often yes. BI tools explain what is happening, while low-code platforms like UI Bakery help teams act on those insights.
Which tool is best for executive reporting?
Power BI and Looker are the strongest options for standardized, executive-level reporting.
Which platform is best for internal business analysis tools focused on operations?
UI Bakery stands out when analysis must lead directly to internal workflows, approvals, or data updates.
How do internal strategy analysis tools differ from product analytics?
Strategy tools focus on company-wide performance and operations, while product analytics tools like Amplitude focus on user behavior inside digital products.


"The UI Bakery platform offers a cost-effective approach to creating applications. With UI Bakery, you can achieve your app development goals without breaking the bank."

"Before switching to UI Bakery we developed a number of apps within the Retool system. The Retool system was good but ultimately did not have the flexibility and feature sets that we required."
Check the Story